Texas Instruments
Land Erosion - Running Off With Soil
Learners evaluate the relationship between rainfall and runoff of a small island for one year. In this rainfall vs. runoff lesson, young scholars analyze the relationship between the rainfall and the runoff on Barro Colorado Island over...
Texas Instruments
How Do Pinnipeds Stay Warm?
Learners experiment to determine ways different types of insulation materials work. In this animal adaptation lesson plan, they make hand coverings from plastic bags, shortening, feathers, and wool. They observe effects of these...
Texas Instruments
Can You Breathe Like a Pinniped?
Young learners compare the breathing patterns of different animals in this pinniped instructional activity. They examine the breathing pattern of California sea lions and northern elephant seals. Pupils collect, compare and analyze data...
Curated OER
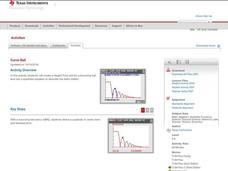
Curve Ball
Learners explore the concept of parabolas by collecting quadratic data on a bouncing ball as it is falling using a motion detector. They plot the data and determine the equation of the quadratic in vertex form, then determine the values...
Curated OER
Introduction to Electric Circuits
High schoolers explore using a circuit board in this physics lesson. They will analyze current and battery set up on a circuit board. Teachers check the board before the students experiment.
Curated OER
Hit and Run
Pupils explore data collection in this lesson. They investigate distance vs. time and velocity vs. time graphs using information collected with a CBR 2 to simulate the reconstruction of an accident.
Curated OER
Match Me!
Young learners explore motion graphs in this lesson. They investigate distance-time plots as they move in a specific way in front of the CBR in an attempt to make a motion plot that matches a given plot. Pupils explore the connections...
Curated OER
Slow Down - Speed Up
Pupils explore the concept of distance and time as they use a CBR to mimic distance v. time graphs. Learners walk towards and away from the monitor to create various distance v. time graphs, then discuss what motion creates certain graphs.
Curated OER
Falling Objects
High schoolers examine the velocities of two different falling objects. They produce distance vs. time and velocity vs. time graphs using a Motion Detector and a CBL 2 to collect experimental data. Learners analyze and interpret the...
Curated OER
Walk the Line
Learners create constant speed versus motion graphs. They will perform linear regressions on their data to describe the graphs mathematically.
Curated OER
Angling for Distance
Explore the concept of projectile distance through determining the angle that will provide the maximum distance of a launched projectile. Students launch baseballs on a football field and video tape the path of the ball.
Curated OER
Flipping Coins: Density as a Characteristic Property
Young scholars explore linear functions in a crime solving context. They collect and analyze data using linear equations, then interpret the slope and intercepts from a linear model.
Curated OER
Fundamental Topics in Science App
Pupilss explore science using technology in this instructional activity. They manipulate the TI to find important science topics. This activity requires a TI-84 or higher.
Texas Instruments
Data Collection for Bar Graphs
Learners study the concept of central tendency in this data collection for bar graph lesson. They collect data outside as instructed and organize it into a bar graphs, then they list in specific groups the labels that appear on the...
Curated OER
Graphing the Absolute Vaule Function
Learners investigate the graph of the absolute value function and the relationship between the parameters of the equation and the graph of the function.
Curated OER
FCAT Real World Solving Linear Equations/Systems
Pupils relate real life situation to the equations, graphs and inequalities. They model real life scenarios using matrices and draw conclusions from their data. This lesson plan is aligned with FCAT.
Curated OER
Augmented Matrices
Pupils write systems of equations in an augmented matrix and enter it into their calculator. They use the reduced row echelon function on the calculator to solve the system of equations.
Curated OER
Graphing Systems at the Races
Learners investigate systems of equations as they use the Ti-Navigator to explore scenarios about dog races and NASCAR races. Pupils determine the winner of the race and when opponents pass each other given a speed and distance.
Curated OER
Perimeter Pattern
High schoolers investigate perimeter patterns formed by a hexagon and a triangle. They will identify the dependent and independent variable and write a function for the relationship.
Curated OER
Quick Stats with Quick Poll
Learners analyze data using bar graphs and the TI in this statistics lesson. They investigate quick polls and graph the data using different properties of statistics. This assignment requires a TI Navigator.
Texas Instruments
Making Predictions Using Systems of Equations
Students explore the concept of systems of equations. In this system of equations activity, students enter data into lists on their calculators about 100 meter dash times. Students plot the points using a scatter plot and perform a...
Curated OER
Chill Out: How Hot Objects Cool
Teach how to explore exponential equations. In this Algebra II lesson plan, students investigate the graph that occurs as a hot liquid cools. Students model the data algebraically.
Curated OER
Curve Fitting
Pupils investigate linear, quadratic, and exponential regressions. They plot sets of data points, determine the regression equation that best fits the data and lastly investigate the coefficient of determination.
Curated OER
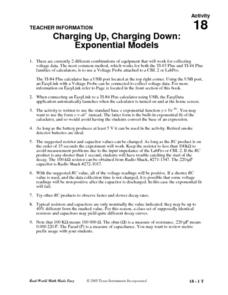
Charging Up, Charging Down
Learners collect and analyze voltage data. Then, they investigate exponential functions using the TI and a Voltage Probe and graph their data and analyze it using a table.


