Texas Instruments
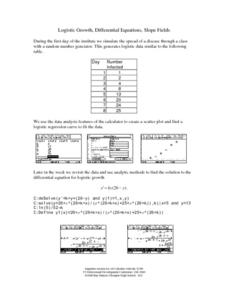
Logistic Growth, Differential Equations, Slope Fields
Investigate differential equations with your class. They use the TI-89 to explore differential equations analytically, graphically, and numerically as the examine the relationships between each of the three approaches.
Curated OER
Home Sales Records
Teach your class how to calculate monthly payments on a home mortgage. For this percent lesson, students calculate the monthly payment on a home mortgage, and compare different lengths of time and the interest rates for national median...
Curated OER
Paying College Tuition
The investigation of exponential equation in the context of increasing college tuition costs is explored through this lessib. Students write exponential equations based on the percent of change of college tuition and use their...
Curated OER
NUMB3RS Activity: Exponential Growth
Mathematicians investigate exponential growth by exploring two different options for receiving allowance. Students use technology to compare a linear function with a constant rate of growth to a function that grows exponentially...
Curated OER
Where Should They Hold the Fundraising Party?
Pupils explore financial applications of linear functions. As they investigate the steps necessary to plan a fundraising event, learners explore minimizing cost and maximizing profits.
Curated OER
Wrapping It All Up
Through learning how to examine linear, quadratic, and exponential functions, students explore the effects of changes in parameters on the graphs of linear, quadratic, and exponential functions. The lesson plan is designed to be a...
Curated OER
Multiplying Monomials
High schoolers differentiate between linear and quadratic functions. For this algebra lesson, students write equations of graphs and graph a function from an equation. They also identify the slope and y-intercept.
Curated OER
Evaluation Expressions
High schoolers explore algebraic expressions in this Algebra I instructional activity. They evaluate expressions using paper and pencil and then use the TI-83 to provide immediate reinforcements.
Curated OER
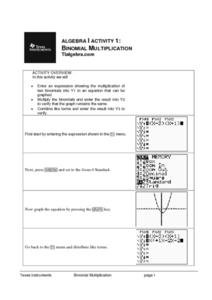
Binomial Multiplication
Learners explore binomial multiplication through the use of technology. Using a graphing calculator, you pupils enter the binomial expression into Y1, multiply the binomials and enter that result into Y2, and combine like terms and enter...
Curated OER
Guess the Ages
Learners explore scatter plots in this algebra lesson. They create a scatter plot from their guesses regarding a famous person’s birth date and the actual birth date then they examine and interpret the results of their graph.
Curated OER
Algebra Nomograph
Investigation of a nomograph teaches learners to determine the rule of a function by examining the input and output values. Students use a nomograph on their Ti-Nspire to determine the function rule. Learners make a scatter...
Curated OER
Approximation of Pi
High schoolers explore the concept of Pi. In this Pi lesson, students measure the circumference and diameter of a circle. High schoolers record the diameter and circumference measurements from their classmates. Students...
Curated OER
Connecting Factors and Zeros
In this Algebra II lesson, high schoolers explore the connection between the factored form of a quadratics and the zero of a function. Students use a graphing calculator to verify factoring numerically and graphically.
Texas Instruments
Graphing Calculator Investigation Graphs of Relations
Learners investigate relations in this algebra activity. They graph the set of ordered pairs that determine a relation. Using a TI-83 Plus, your learners will enter the coordinates in a list, create a scatter plot, and manipulate the...
Curated OER
Getting Started with the TI-Navigator™ System: What's My Line?
Learners analyze linear functions in this algebra lesson. They explore the meaning of slope and the slope-intercept form of a line as they investigate the effect changing parameters on the graph of a linear function.
Curated OER
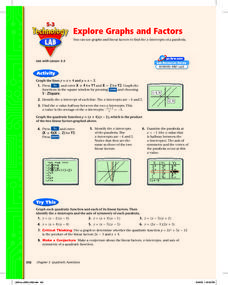
Explore Graphs and Factors
Pupils graph the factors of a quadratic as linear equations and graph the parabolic equation in factored form. Also, they investigate the relationship between the x-intercepts of the lines and the zeros of the parabola.
Curated OER
Rational Numbers
Young scholars investigate rational numbers in this algebra lesson. They graph systems of equations and use technology to find the point of intersection. They need a TI for this assignment.
Curated OER
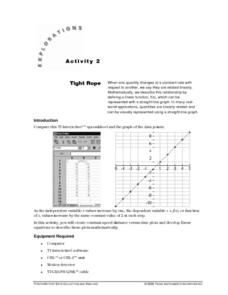
Tight Rope
Learn how to explore the concept of linear functions. In this linear functions lesson, students collect linear data from a motion detector. Students walk to create a linear function. Students plot the points on a graph...
Curated OER
You Must Still Think Yourself, CAS Can Only Help
Have the class learn about and make conjectures about a line intersecting a cubic. In this making conjectures about a line intersecting a cubic lesson plan, students draw lines that intersect a cubic at three different...
Curated OER
NUMB3RS Activity: Settling The Score
Learn how to investigate matrix multiplication. In this secondary mathematics lesson, students examine matrix multiplication in the context of a Homes-Rahe stress test which is similar to the process used to score figure...
Curated OER
NUMB3RS - Season 3 - "Provenance" - Set the Trap
Learners investigate concept of matrices through iteration in this probability lesson. They investigate probability by creating a lesson based on a famous painting. This assignment contains extensions to the...
Curated OER
Collecting Ball Bounce Data
Learners investigate quadratic equations as they use a CBR to collect and analyze data regarding a bouncing ball. Pupils explore different methods for determining the equation of the parabolic path including quadratic regression and...
Curated OER
Graphing Quadratic Functions
Pupils explore quadratic functions in this algebra lesson. They investigate transformation of quadratic functions using the TI calculator. They use the vertex form for this lesson.
Texas Instruments
Math TODAY for TI-Navigator System - Is Leisure Time Really Shrinking?
High schoolers organize data from the USA TODAY Snapshot, "Is leisure time really shrinking?" into two scatter plots and determine the quadratic model for each scatter plot. They determine if these graphs intersect and learn the concept...


