Curated OER
Isolines on a Weather Map
Ninth graders recognize isolines on a weather map and draw isolines based on temperature data on a weather map. They draw isotherms on a weather map to identify temperature patterns.
Curated OER
Weather, Sea Level Rise and Climate Change
Students differentiate weather and climate. In this earth science lesson, students compare weather and climate in different regions of the world. They interpret weather graphs and compare isotherm lines of northern and southern hemisphere.
Prince William Network
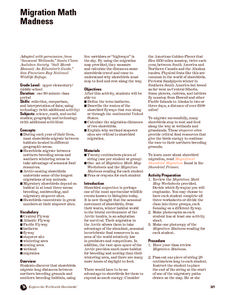
Migration Math Madness
A great way to incorporate math into life science, this lesson has learners measure migratory routes on a map and calculate the actual distance that shorebirds on the routes would cover. Learners compute the distance covered in both...
Curated OER
Mapping a Temperature Field
Students measure and graph temperatures. For this temperature field lesson students use a map to measure and plot field values and construct isolines and interpret the results.
Curated OER
Extreme Heat
Pupils, in groups, investigage and demonstrate the science behind the development and characteristics of extreme heat.
Curated OER
Weather Forecasting Basics
Eighth graders analyze weather diagrams and weather maps. In this earth science activity, 8th graders explain why it is important to know the weather. They complete a handout at the end of the activity.
Polar Bears International
Top of the World
Learn about polar bears and the Arctic circle with a lesson about the countries and conditions of the region. After examining how the area differs from Antarctica, kids explore climates, animals, and geographical position...
Curated OER
Weather Analysis - Lab Activity
Ninth graders perform research in the subject of weather to answer several key questions to increase comprehension of concepts. Students use weather prediction as an application for the research.
Curated OER
Weather Map
Ninth graders utilize several different types of maps to forecast weather conditions specific areas of the country. Air masses, wind, cloud types, fronts, and the pH of the rain is explored in this lesson.
Curated OER
The Laws of Thermodynamics
Students investigate the concept of a thermodynamic system. The difference between a state and phase is defined as part of the experimental explanations given in writing. Students conduct experiments to demonstrate laws of science like...
Curated OER
Air Masses & Fronts
Students identify two distinct air masses and the frontal boundary and determine whether the front is moving in time and in what direction the front is moving.
Curated OER
Air Masses & Fronts
Students use a set of maps depicting a front passing through the state to identify two distinct air masses and the frontal boundary. They then deterine whether the front is moving in time and in what direction the front is moving.
Curated OER
Practice Test Chapter 12: Energy Changes in Chemical Reactions
For this chemistry practice test worksheet, pupils review their knowledge of energy changes in chemical reactions as they answer 17 multiple choice and short answer questions.
Curated OER
Isolines on a Weather Map
Ninth graders explore weather by analyzing maps. In this temperature instructional activity, 9th graders view black and white weather maps of locations in which the weather changes often. Students identify the isolines used on the maps...
Curated OER
Introduction to Drawing Isopleths
Students draw isopleths based on how many pieces of "confetti snow" land in their cup.
Other popular searches
- Isobars and Isotherms
- Isobar and Isotherm
- Isotherm and Isobar Maps
- Isotherm Maps
- Drawing Isotherms Lines
- Isotherms Weather Map
- Isotherm Worksheets
- Isotherm Lines
- Adiabatic Isothermal
- Isotherms Lines
- Isothermal Bars


