Curated OER
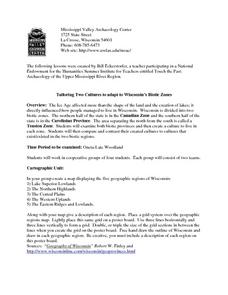
Tailoring Two Cultures to Adapt to Wisconsin's Biotic Zones
Middle schoolers examine the effect of the various ice ages on Wisconsin. In groups, they create a map representing the five geographic regions of Wisconsin. They must write out a description of each region to be placed on a poster...
Curated OER
What's Under There?
Students determine ways to make "observations" about unknowns, such as the land beneath an ice sheet or the interior of the Earth, using tools other than sight. They build "mystery boxes" and exchange them with other groups to "map"...
Curated OER
Virginia in the Civil War
Students examine the role of Virginia during the Civil War. In groups, they brainstorm ideas about why they believe so many battles took place in Virginia. Using a map, they locate the major battles on land and in the ocean. To end...
Curated OER
Driving Forces Forestry In Canada
Students discuss the natural and economic impact of forests and forestry. Using given statistics they construct different types of graphs in which they make observations and draw conclusions.
Curated OER
Geography: How do Louisiana Rice Farmers Help the Environment after they Harvest Rice?
Third graders study maps of the United States locating Louisiana, the East Coastal Plain, the Mississippi Alluvial Plain, the West Gulf Coastal Plain, and five of the main rivers. In this geography lesson, 3rd graders create a...
Curated OER
Introduction to Drawing Isopleths
Learners draw isopleths based on how many pieces of "confetti snow" land in their cup.
Curated OER
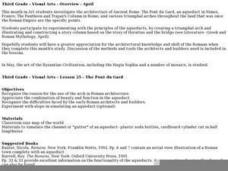
Visual Arts - Overview - April
Third graders investigate the architecture of Ancient Rome, The Pont du Gard, an aqueduct in Nimes, France; The Pantheon and Trajan's Column in Rome; and various triumphal arches throughout the land that was once the Roman Empire are the...
Curated OER
Political Cartoons of the American Revolution
Eighth graders examine various political cartoons from the American Revolution era. Using present day political cartoons, they compare and contrast the ones from the past to the ones of today. As a class, they discuss the use of...
Curated OER
Watersheds
Students discover the importance of watersheds and how they impact other bodies of water. Using a map, they identify and analyze a watershed in their local area and evaluate the health of the water nearby. In groups, they plan their...
Curated OER
Big Blue Sky- Based on the Montana Quarter Reverse
Students use a Montana quarter to help describe geographical features such as landforms and bodies of water. Students read an article about Montana as a group and discuss examples of landforms and bodies of water. After reading,...
Curated OER
Comparing Northwest Native American Communities
Students review how to use the database from previous lessons. Using the information, they identify the historical and environmental effects on the people living in the Pacific Northwest. They examine the various Native American groups...
Curated OER
Weather and the D-Day Invasion
Middle schoolers study the weather that occurred during the invasion of Normandy. They research using the Internet to locate information about the invasion and the meteorologists who helped during the war effort. They
Curated OER
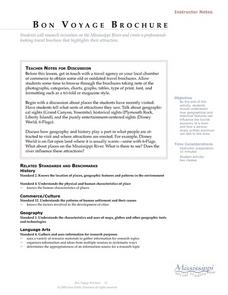
Language Arts: Mississippi River Brochure
Students create brochures about recreational activities along the Mississippi River. Focusing on points of interest, they research attractions and create maps of the surrounding area. Once students write descriptions of their...
Curated OER
SC Populations Along Major Interstates
Students examine the population among the interstates in South Carolina. Using the internet, they identify the counties and roads and compare it with their own drawing.
Curated OER
Language Families
Fourth graders identify and locate the three language families of North Carolina. They calculate the physical area covered by each language family and label them on a map.
Curated OER
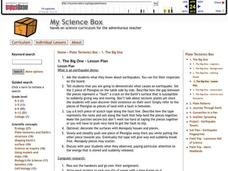
The Big Crush
Learners examine weather maps from their state from the past few days. They examine the Highs and Lows on the maps to determine what kind of weather they produce. They use that information to better prepare for their activities and what...
Curated OER
Case Studies: Cross-Cultural Comparison
Students examine maps of Lebanon, Vietnam and Nigeria, discuss relationship between ethnicity, land and conflict, review material from case studies, complete comparison chart, and write essays comparing two of the case studies.
Curated OER
History-Causes of WW I
Seventh graders participate in a class discussion about what caused World War II. Working in groups, they identify the reasons they believe were most important in starting the war and present their reason in the form of a PowerPoint,...
Curated OER
Meteorology
Seventh graders examine the job of meteorologists. They decide which characteristics of the atmosphere that meteorologists focus on. They use local weather maps from newspapers to predict weather in their area.
Curated OER
The BIG One
Students observe an earthquake demonstration. They research an earthquake and use color dots to plot the location of each of their earthquakes on the large map.
Curated OER
Maui: People, Places and Patterns
Students predict patterns of growth on the island of Maui, complete a research paper on Maui using one of the geographic perspectives, and share their findings with others through an oral and written report.
Curated OER
Circle the Earth - Explore Surface Types on a Journey around Earth
Learners use CERES percent coverage surface data with a world map in locating landmasses and bodies of water at Earth's Equator.
Curated OER
The Hawaiian Islands
Fourth graders present information of people, places, and environments. They collect, organize, and analyze date to use with these representations.
Curated OER
Solid Waste and Recycling
In this unit of lessons, pupils examine solid waste and recycling. They examine the relationship between Native Americans and land. They also decorate bags in which they discover the concept of decomposition.


