Curated OER
Charles R. Savage Lesson Plan Ideas
Students explore works by English photographer Charles R. Savage. In this visual arts instructional activity, students investigate photography by Savage as they discuss the use of perspective, space, color, and texture.
Curated OER
The American Land
Students identify the 5 major regions of the United States on a map and then research one of the regions in groups. In this regions lesson plan, students use their textbooks to research.
Curated OER
Puritans Lesson Plan
Students determine if the Puritans were selfish or selfless. In this American history lesson, students read two Puritans documents, answer guiding questions on a worksheet, and use evidence from the documents to write whether the...
Curated OER
River Planning
Students use a model to conduct an experiment involving dam construction. Based on their observations, they draw conclusions about social, economic, and and environmental issues and make a decision concerning dam location. As a group,...
Curated OER
Capitol Visitors Center, Pre-Visit Lesson Plan, Grades 7 and 8
Students, through lecture and discussion, identify public lands of Texas and how the land was used during the 19th century. They read selections about public lands and work in groups to answer questions about the readings. In groups,...
Curated OER
Mission Planning: Geography
Students investigate the use of latitude and longitude to locate specific locations on Earth and evaluate that location as a potential landing site for researchers, terrestrial or alien space missions.
Curated OER
Birch Bark Biting
Fifth graders create birch bark biting art pieces. For this aboriginal art lesson, 5th graders produce art using birch bark. Students present their art pieces and explain their designs.
Curated OER
Sensational Seaweed
Students compare kelp and land plants. In this sea plant lesson, students look at the role of algae in aquatic environments. They research the properties of kelp and explore seaweed.
Curated OER
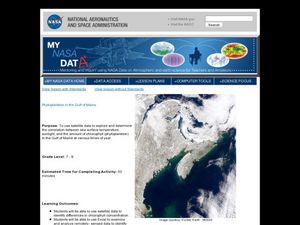
Phytoplankton in the Gulf of Maine
Learners use satellite data to see the correlation between sea temperature and sunlight in the Gulf of Maine. For this phytoplankton lesson students use Excel to analyze data.
NASA
Climate Change Online Lab
What are the key indicators that show scientists that our planet is in the fastest warming trend ever? Learners go on a WebQuest to examine the evidence for themselves. Following several links to NASA sites, kids see how the global...
Curated OER
Allusion in Poetry
Emerging writers identify allusion in poetry by listening to recorded poems, like Anyone Lived in a Pretty How Town. They also discuss what makes writing satirical and how writers use allusions to make satirical points.
PBS
Regional Patterns of Climate: Pacific Northwest
Climate systems involve sunlight, ocean, atmosphere, ice, land forms, and many other factors. Scholars explore each of these variables related to the Pacific Northwest rain forest. They use an online interactive to investigate the polar...
Curated OER
Creating Climographs
Students use satellite data to compare precipitation and surface temperatures on different islands. In this satellite lesson students create graphs and explain the differences between weather and climate.
Curated OER
Does cloud type affect rainfall?
Student use MY NASA DATA to obtain precipitation and cloud type data. They create graphs of data within MY NASA DATA. Students compare different cloud types, compare precipitation, and cloud type data They qualitatively describe graphs...
Polar Trec
Create a Topographic Profile of Beacon Valley
Landforms in Beacon Valley, Antarctica, where there is no snow, bear a striking resemblance to landforms found on Mars. Scholars identify landforms found in Beacon Valley through analysis of topographic maps in the activity. They then...
Gilder Lehrman Institute of American History
Women's Suffrage: 140 Years of Struggle
Young scholars create PowerPoint presentations about women's suffrage. In this women's rights instructional activity, students use primary documents to study the women's suffrage movement. In pairs, young scholars create a PowerPoint...
Curated OER
Differences Between Ground and Air Temperatures
Students examine the differences between air temperature and ground temperature. In this investigative instructional activity students find NASA data on the Internet and use it to create a graph.
Curated OER
The Living Earth-Glaciers
Young scholars investigate glaciers. In this earth science lesson, students use sandy ice cubes to observe how glaciers change the land. Young scholars list forces that cause changes in the Earth's surface.
Curated OER
Calculating Population Growth for a Region
Young scholars research population growth of regions of Canada. In this Social Studies lesson, students use included links on the Internet to find information about population growth in areas of Canada. A worksheet for each region is...
Curated OER
Ancient Americas
Seventh graders compare artifacts used by archaeologists to theorize the first inhabitants of the Americas migrated from Asia across the Bering Land Bridge.
Alabama Learning Exchange
Forces that Change the Land
Students conduct Internet research find information about the following landforms: mountains, canyons, and valleys. They create travel brochures of their findings.
Curated OER
Forest Forensics
Pupils explore forests. In this "forest forensic" lesson students divide into groups and go through the stations using their clues to solve the questions.
Curated OER
Plate Tectonics & Land Forms
Fourth graders discuss the different interactions of plates and the ways mountains are created. In this plate tectonics lesson students complete an activity in groups.
Curated OER
Excel Lesson Plan Coin Statistics
Second graders determine the difference between making a prediction and determining actual information. They design a spreadsheet for a coin flipping activity on which they include their predictions and what actual happens when they flip...


