Curated OER
Drops on a Penny
A helpful worksheet describes an interesting demonstration on the surface tension of water. Learners guess how many drops of water the heads side of a penny will hold. This resource does a great job of describing just how a penny can...
Curated OER
Ornithology and Real World Science
Double click that mouse because you just found an amazing lesson! This cross-curricular Ornithology lesson incorporates literature, writing, reading informational text, data collection, scientific inquiry, Internet research, art, and...
Curated OER
Drops on a Penny
Young scientists explore the concept of surface tension at is applies to water. In this activity, learners use a dropper to place drops of water on a penny. Each group guesses how many drops a heads-up penny will hold, then conducts the...
Museum of Tolerance
Why is This True?
Are wages based on race? On gender? Class members research wages for workers according to race and gender, create graphs and charts of their data, and compute differences by percentages. They then share their findings with adults and...
Curated OER
Whose Breakfast isn't for the Birds?
Students explore coffee production. For this cross-curriculum rainforest ecology lesson, students research regions where coffee comes from and investigate how the native birds in the rainforest are effected by coffee production. ...
Curated OER
Histograms and Bar Graphs
Students are introduced to histograms, bar graphs, and the concept of class interval. They use an activity and three discussions with supplemental exercises to help students explore how data can be graphically represented (and...
Curated OER
Sets an the Venn Diagram
Students explore the characteristics of sets and Venn Diagrams. Given data, students practice determining the placement of elements in a Venn Diagram. Students discuss the correspondence between data sets and their graphical...
Curated OER
Statistics: Misleading or Accurate?
Students explore the concept of misleading statistics. In this misleading statistics lesson, students play a game of tag and graph the number of times each student gets tagged. Students use the graph to determine the fastest runner in...
Curated OER
A Statistical Look at Jewish History
Learners complete their examination over the Jewish Diaspora. Using population figures, they discover the importance of percentages in exploring trends. They use their own ethnic group and determine how it is represented in the United...
Curated OER
BEETLES: The Coming Out
Students design an experiment to test the variables involved in the hatching of the Bruchid beetle.
Curated OER
Schoolyard Bird Project
Students observe and count bird sightings around their schoolyard throughout the school year.
Curated OER
Which Amusement Park Would You Choose?
Students analyze data related to amusement parks and create a spreadsheet to display the data. They read the data and predict which amusement park they think is safer, create a spreadsheet and graph, and write a proposal based on their...
Curated OER
Quartiles, Percentiles, and Cumulative Frequency
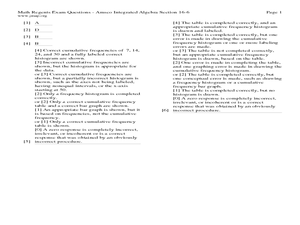
In this statistics lesson, 11th graders are asked to calculate the percentiles, quartiles and cumulative frequency given different graphs and data. There are 6 questions with an answer key.
Curated OER
Graph it!
Sixth graders view a Stacked Graph, and discuss what it shows. Students discuss the basics of graphing: labels, intervals, legends x and y axis... Students create individual stacked graphs from provided information. Students view a...
Curated OER
Infusing Equity Gender into the Classroom
Students investigate if gender makes a difference in the classroom. For this statistics lesson, students collect data on whether equity by gender in the classroom makes students more successful.
Curated OER
Tag It and Bag It: Archeology Lab Lesson
Seventh graders practice analyzing, collecting and categorizing artifacts. Using charts, they organize and interpret information about the artifacts they classified. They work together to create a graph to represent class totals and...
Curated OER
Data Shuffle
Students find an advertisement or newspaper using charts or graphs. They create another graph using the same information in a different format. They write a comparison of the two graphs.
Curated OER
Problem-Solving Application: Use a Graph
For this problem solving worksheet, 6th graders use the problem solving steps of understand, plan, solve and look back to answer a graphing question.
Curated OER
Analyzing Graphs and Data
Students collect and analyze data. In this statistics instructional activity, students graph their data and make inferences from the collected data. They display their data using graphs, bar graphs, circles graphs and Venn diagrams.
Curated OER
Mathematical Models with Applications: The Sounds of Music
Students use an electronic data-collection device to model the sound produced by a guitar string. They identify the graph of a periodic situation and use the graph to determine the period and frequency of sound waves.
Curated OER
Comparison of Two Different Gender Sports Teams - Part 1 of 3 Measures of Central Tendency
Students gather and analyze data from sports teams. In this measures of central tendency lesson, students gather information from websites about sports team performance. Students analyze and draw conclusions from this data. This lesson...
Curated OER
Statistical Analysis of Data by Gender
Students examine and identify gender bias, stereotyping, and discrimination in school materials, activities, and classroom instruction. They apply descriptive statistics knowledge to real-world data.
Curated OER
Travel Mug Design
Students create and develop a travel mug. They create visuals and a three dimensional infomercial. They apply an engineering design and demonstrate knowledge of thermodynamics involved in heat transfer. They illustrate Newton's Law of...
Curated OER
Statistics Newscast in Math Class
Students study sports teams, gather data about the teams, and create a newscast about their data. In this sports analysis lesson, students research two teams and define their statistical data. Students compare the two teams, make...


