Curated OER
Closing the Case
Fifth graders collect data and prepare data displays using a survey with statistical information.
Curated OER
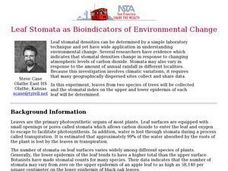
Leaf Stomata as Bioindicators of Environmental Change
Students perform an experiment to determine the stomaltal index on the upper and lower epidermis of two species of leaves. Stomatal densities change in response to changing atmospheric levels of carbon dioxide and to annual rainfall.
Curated OER
DRASING NATURE
Learners take samples of local trees and identify the tree using a field guide. They keep data for the tree on the Tree ID sheet. They create leaf, seed, bark, and flower prints and paint them.
Curated OER
"Hard" Data from Space
Students use satellite images to analyze development patterns within Baltimore City. They prepare a land cover map for Baltimore indicating the prevalence of impervious surfaces and explore how these patterns affect water pollution.
Curated OER
Tech Algebra: A Statistics Study
Students use the internet to gather a minimum of thirty pieces of data. Students create box and whisker graphs, and stem and leaf plots from the information. They calculate mean, median, mode, and range. Students write a summary and...
Curated OER
Statistics with State Names
Students analyze the number of times each letter in the alphabet is used in the names of the states. In this statistics lesson, students create a stem and leaf plot, box and whisker plot and a histogram to analyze their data.
Curated OER
Who's got the fastest legs?
Students use a stopwatch to collect information for a scatterplot. In this fastest legs lessons, students collect data through the taking of measurements, create and find a median number. Students develop an equation and answer...
Curated OER
Box-and-Whisker Plots
Eighth graders measure in feet and inches and convert to explore the relationship between the converted measurements. In this measurement lesson plan, 8th graders use the whisker and box plot to represent the measurement of a cat. ...
Curated OER
Science: Leaf Study
First graders go on a leaf-hunting expedition around the schoolyard. They determine from which trees they fell using identification cards. Students read several books about leaves and apply their artistic skills by using the collected...
Curated OER
Caverns: Drip Rate Analysis
Students tour a cave and collect water samples. They measure the drip rate from several locations inside the cave and discover the part water plays in cave formation.
Curated OER
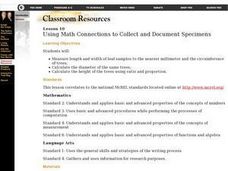
Using Math Concepts to Collect and Document Specimens
Students determine the length and width of leaf samples to the nearest millimeter and the circumference of trees. They participate in a discussion about the importance of collecting specimens carefully. They compile accurate...
Curated OER
Stem-and-Leaf Plots
Students are introduced to stem-and-leaf plots and calculating the mean, median, and mode from the plots.
Curated OER
Smile Metric Style
Learners explore how to use a metric ruler to measure length, accurately read and record measurements taken in centimeters (cm) and millimeters (mm), and collect and analyze data using a stem and leaf.
Curated OER
Childhood Obesity
Students identify a question to generate appropriate data and predict results. They distinguish between a total population and a sample and use a variety of methods to collect and record data. Students create classifications and ranges...
Curated OER
Box-and-Whisker
Seventh graders are introduced to the concept of box-and-whisker plots. A step-by-step process for creating a box-and-whisker plot is provided. The goal of the lesson is that students study the components of a box-and-whisker plot and be...
Curated OER
Herb is the Word
Students graph the data collected on seedling establishment and
survival for each soil type over a 6 week period. Each lab group graphs data
gathered from one plant. They choose a color for each soil type and create a key for the...
Curated OER
Statistics Newscast in Math Class
Students study sports teams, gather data about the teams, and create a newscast about their data. In this sports analysis instructional activity, students research two teams and define their statistical data. Students compare the two...
Curated OER
Box Plots
Students review the concept of median, explore how to calculate quartiles for any size data set and experience how to build a box plot.
Curated OER
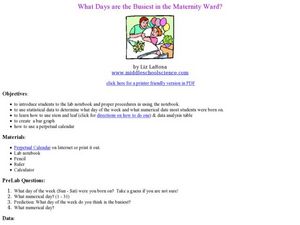
What Days Are the Busiest in the Maternity Ward?
Students form a conclusion using statistical data. In this statistical data lesson plan, students collect and analysis data to form a conclusion about what day of the week most babies are born.
Curated OER
Histograms and Bar Graphs
Students are introduced to histograms, bar graphs, and the concept of class interval. They use an activity and three discussions with supplemental exercises to help students explore how data can be graphically represented (and...
Curated OER
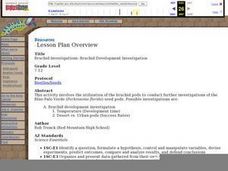
Bruchid Investigations: Bruchid Development Investigations
While this lesson plan is based on the Bruchid beetle, the focus is on conducting a scientific investigation. Ecology explorers vary the temperature or the type of leaf that Bruchid eggs are laid on and test for effects on the...
Curated OER
Tree I.D.
Students explore various tree species. In this tree species instructional activity, students collect leaves on nature walks and use Internet sources to identify the trees that the leaves belong to. Students graph their data as well.
Curated OER
Sets an the Venn Diagram
Students explore the characteristics of sets and Venn Diagrams. Given data, students practice determining the placement of elements in a Venn Diagram. Students discuss the correspondence between data sets and their graphical...
Curated OER
Record 'The' Results
Third graders predict how many times they'll see the word "the" in a newspaper page and highlight all the "the"s they find. After reviewing definitions of range, median, mode, mean they create a Stem and Leaf Plot and a Back-to-Back Stem...


