Curated OER
Caverns: Drip Rate Analysis
Students tour a cave and collect water samples. They measure the drip rate from several locations inside the cave and discover the part water plays in cave formation.
Curated OER
Using Math Concepts to Collect and Document Specimens
Students determine the length and width of leaf samples to the nearest millimeter and the circumference of trees. They participate in a discussion about the importance of collecting specimens carefully. They compile accurate...
Curated OER
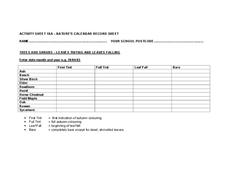
Nature's Calendar
In this autumn leaves worksheet, students document when trees begin to change colors in the fall and when the tree is completely bare. Students collect this data in a graphic organizer.
Curated OER
Stem-and-Leaf Plots
Students are introduced to stem-and-leaf plots and calculating the mean, median, and mode from the plots.
Curated OER
Smile Metric Style
Learners explore how to use a metric ruler to measure length, accurately read and record measurements taken in centimeters (cm) and millimeters (mm), and collect and analyze data using a stem and leaf.
Curated OER
Childhood Obesity
Students identify a question to generate appropriate data and predict results. They distinguish between a total population and a sample and use a variety of methods to collect and record data. Students create classifications and ranges...
Curated OER
Box-and-Whisker
Seventh graders are introduced to the concept of box-and-whisker plots. A step-by-step process for creating a box-and-whisker plot is provided. The goal of the lesson is that students study the components of a box-and-whisker plot and be...
Curated OER
Herb is the Word
Students graph the data collected on seedling establishment and
survival for each soil type over a 6 week period. Each lab group graphs data
gathered from one plant. They choose a color for each soil type and create a key for the...
Curated OER
Statistics Newscast in Math Class
Students study sports teams, gather data about the teams, and create a newscast about their data. In this sports analysis instructional activity, students research two teams and define their statistical data. Students compare the two...
Curated OER
Box Plots
Students review the concept of median, explore how to calculate quartiles for any size data set and experience how to build a box plot.
Curated OER
What Days Are the Busiest in the Maternity Ward?
Students form a conclusion using statistical data. In this statistical data lesson plan, students collect and analysis data to form a conclusion about what day of the week most babies are born.
Curated OER
Histograms and Bar Graphs
Students are introduced to histograms, bar graphs, and the concept of class interval. They use an activity and three discussions with supplemental exercises to help students explore how data can be graphically represented (and...
Curated OER
Bruchid Investigations: Bruchid Development Investigations
While this lesson plan is based on the Bruchid beetle, the focus is on conducting a scientific investigation. Ecology explorers vary the temperature or the type of leaf that Bruchid eggs are laid on and test for effects on the...
Curated OER
Tree I.D.
Students explore various tree species. In this tree species instructional activity, students collect leaves on nature walks and use Internet sources to identify the trees that the leaves belong to. Students graph their data as well.
Curated OER
Sets an the Venn Diagram
Students explore the characteristics of sets and Venn Diagrams. Given data, students practice determining the placement of elements in a Venn Diagram. Students discuss the correspondence between data sets and their graphical...
Curated OER
Record 'The' Results
Third graders predict how many times they'll see the word "the" in a newspaper page and highlight all the "the"s they find. After reviewing definitions of range, median, mode, mean they create a Stem and Leaf Plot and a Back-to-Back Stem...
Curated OER
Tables
In this tables worksheet, 4th graders analyze a table with data concerning the collection of leaves. Students problem solve 8 subtraction word problems.
Curated OER
What is the Composition of Soil?
Students examine the different components that make up soil. Using data, they identify the components of soil in their local area and discover how scientists use the soil to see how it was formed. They also describe the soil forming...
Curated OER
Science: Fossil of a Carbonized Plant
Learners classify leaves by shape and margins and use them to create models of plant fossils. By using paper over a leaf, they simulate fossilization of organisms onto sedimentary rocks. Following instructions on worksheets, students...
Curated OER
Strange New Planet
Fourth graders gather data and simulate a Mars spacecraft mission using multi-sensory observations.
Curated OER
Plotting with Pennies
Fifth graders use pennies to gather data, organize and order data, graph the data on a stem-and-leaf plot, and evaluate the range, median, and mode of the data.
Curated OER
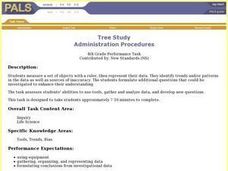
Tree Study
Students measure the lengths of provided leafs to the nearest millimeter. Students identify trends in the data as well as sourced of inaccuracy and formulate additional questions that could be investigated to enhance their understanding.
Curated OER
Infusing Equity Gender into the Classroom
Students investigate if gender makes a difference in the classroom. In this statistics lesson, students collect data on whether equity by gender in the classroom makes students more successful.
Curated OER
comparison of Two Gender Sports Teams
Students gather data on sports team and create a box and whisper plot. In this data collection instructional activity, students find the median, the quartile range, and relationships between variables.


