Curated OER
Ratios and Proportions
Students solve problems involving percents and ratios. In this algebra lesson, students convert decimals to percents and percents to decimals. They solve problems involving algebraic expressions and four different kinds of percent problems.
Curated OER
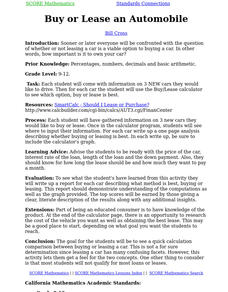
Buy or Lease an Automobile
Students gather information on 3 new cars they would like to buy or lease, and use mathematical comparisons to decide whether to buy or lease the car.
Curated OER
The Big Hand Challenge
Students utilize a computer spreadsheet to record and analyze data. In this problem solving lesson, students compare their hand size to that of the principal. Students understand standard and nonstandard measurement.
Curated OER
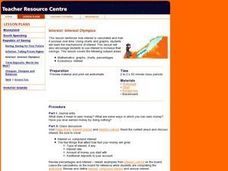
Interest: Interest Olympics
Students determine how interests is calculated and a how it accrues. They examine charts and graphs that show the intricacies of interest. They determine how to increase their own saving by using interest while working with a partner to...
Curated OER
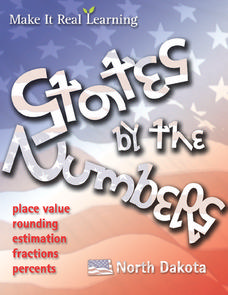
Using Real-Data from North Dakota to Study Place Value, Rounding, Estimation, Fractions, and Percents
In this real-data worksheet, students use data from the 2008 Census Bureau to answer eight questions divided into four activities. The topics covered include: place value, rounding, estimation, fractions, and percents.
Curated OER
Spinning Probability
Sixth graders study the concept of probability. In this probability lesson, 6th graders create spinners that match specific sets of clues. Students use their spinners and worksheets to explore and predict probability.
Curated OER
A Family Finance Experience
Students create a budget and make predictions about money. In this algebra lesson plan,students balance spending and income by monitoring their finance.
Curated OER
EBT-rimental
Students engage in a lesson that gives them the tools needed to become knowledgeable credit consumers. The companion website for the ITV program TV-411 is used to provide learners with an interactive experience of what credit has to offer.
Curated OER
Penny's Pizza
Students develop a list of possible outcomes as a method of finding probability related to a pizza statistics problems. They read the problems together as a class, brainstorm ways to solve the problem, and in partners solve the pizza...
Curated OER
Seeing a Dwarf Planet Clearly: Pluto
In this dwarf planet activity, students use images from the Hubble Space Telescope and they determine the scale of the image, they identify the largest features in the images, they calculate the volume of Pluto and they create a model of...
Curated OER
The Importance of Trees in the Rural Area: Planting a Snowfence
Students discuss the importance of trees and work together to plant a living snowfence. In this tree importance lesson, students discuss why trees are important in rural areas. They use mathematics and team work to plant a living snowfence.
Curated OER
Pen Light Lab
Students study what makes Earth warm and explore how different locations on the planetreceive different amounts of solar energy based on the intensity of the sun's rays. They calculate light intensities and compare the
amounts of light...
Curated OER
Graphing Surveys and Analyzing Data
Young scholars analyze data and graph the results of their surveys. In this statistics lesson plan, students create graphs using excel to make graphs to be able to better observe their data. They conclude how great we as unique individuals.
Curated OER
Magnetic Storms
In this magnetic storms and Earth's magnetic field worksheet, students use a bar graph showing the Kp Index for planetary variability. Students use the bar graph to answer 3 questions about the solar storms and their Kp values.
Curated OER
The Sun as the Driving Force of the Water Cycle
Students study the water cycle and how the sun is an important factor. In this water cycle lesson students investigate how to desalinate water and explore the different densities of fresh versus saltwater.
Curated OER
What Are the Odds?
Middle schoolers identify and interpret various ways of expressing probability as a decimal, fraction, percent, or ratio. They solve problems based on probability as they apply to real world applications.
Curated OER
Wetlands - Food Web Relationships
In this food web relationships activity, students click on the links to learn about the food web relationships in the wetlands and answer short answer questions about it. Students complete 8 questions total.
Curated OER
Saving on Home Energy Use Activity
In this saving energy worksheet, students click on the links to learn about saving energy and then answer short answer questions about it. Students complete 10 questions total.
Curated OER
Determining the Age of Fossils
Students examine the concept of radioactive dating. In this radioactive dating lesson, students investigate how to determine the ages of fossils and rocks as they learn about half-life radioactive decay.
Curated OER
Help! I Need Five Minutes to Study
Students learn to use a time grid or a calendar to increase productivity of their studying. In this studying lesson, students record how they spend their studying time and then adjust as needed. Students recognize various...
Curated OER
The Winning Edge: Probability in Basketball: Lesson 2
Students calculate the probability of a desired outcome based upon a statistically significant number of discrete events (i.e. endgame free-throw attempts). They participate in an online simulation of basketball free throws.
Curated OER
Shadowing a Musher For Nine Days
Seventh graders follow and record the progress of a musher on the Iditarod race. They access the official Iditarod website, determine the musher's overall speed, the daily average temperature and daily hours of sunlight, and develop a...
Curated OER
Understanding Percent
In this understanding percent worksheet, students use a computer program to complete 8 sections, then work off the computer and answer 7 questions with fraction strips, tables and grids.
Curated OER
What Does Percent Have to Do With It?
Fourth graders go shopping for a real life experience involving percent. They explore the concepts of sales tax and discount prices.


