Curated OER
Mathematics In You
Young scholars construct ratios using the hand as data. They use examples of cortical and trabecular bone found in the long bones to measure circumference, diameter, length, and weight of long bones. They perform computations using...
Curated OER
"it's All in the Cellar"
Seventh graders examine the process of constructing a site plan map at archaeological sites. They discuss the process of mapping techniques and calculation of percentages, create a plan site map of a cellar at Jamestown, and calculate...
Curated OER
What do Bison Eat?
Students identify the three major categories of food eaten by bison. In groups, they collect examples of grass and forbs and press them. They complete a chart of the percentages of each type of food the bison eat in a day. They...
Curated OER
Percents, Decimals, and Fractions
In this Algebra I worksheet, 9th graders convert percentages to decimals and fractions. The one page interactive worksheet contains ten problems. Answers and a hint are provided.
Curated OER
Epidemic Proportions
Students research epidemics that have devastated world population at various points in history. They share and calculate statistics obtained in their research and develop graphs comparing and contrasting how different epidemics affect...
Curated OER
Weight Training
Students conduct a class-wide survey collecting, compiling, and analyzing data about fitness, weight loss, and body image issues. They analyze the relationship between exercise and diet in weight control.
Curated OER
Finding the Area Under A Curve with Random Probability
Students explore the concept of area under a curve. In this area under a curve lesson, students find the area under a curve using the Monte Carlo method using random points and probability. Students calculate the area under the same...
Curated OER
Lucky Number
Students use data from simulations to make theoretical generalizations. They discuss possible relationships between several given events and gain understanding about their own mathematical intuition about likelihood.
Curated OER
Selling Price
Students work independently to complete a problem solving activity that involves percent. This lesson is designed to be used as an assessment following a unit on percents. Students are presented with a problem involving a store that is...
Curated OER
Decimals to Percents
In this decimal and percent worksheet, students solve ten problems in which a decimal number to the hundredths place is converted to a percentage. There are no examples.
Curated OER
Graphing Our Snacks
Students gather information from Nutrition Facts labels on their favorite snack foods. They graph the fat content of the foods and reflect on what they see.
Curated OER
Kinzi Deaf Alumni
Pupils use data of school alumni to create a database. The lesson uses technology and access to a computer lab is essential. The concepts of graphing statistics is also used to help teach across the curriculum.
Helping with Math
Ratio and Proportion: Writing Ratios (2 of 2)
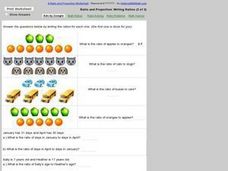
Elementary and middle schoolers use pictures to figure out simple ratios and complete ratio word problems. An example is done for learners in which three apples and seven oranges are displayed. The answer simply is a ratio of 3:7. The...
Curated OER
Statistics with M&Ms
Seventh graders explore estimation, measurement, and probability. Students conduct surveys and create charts & graphs. They study the history of chocolate. Students design their own magazine advertisement or create a script for a...
Curated OER
"NSN, Fractions, Percents, Ratios, Rates" Investigations
Sixth graders engage in an investigation about the concepts related to fractions. They read, represent, compare, and order proper and improper fractions, and mixed numbers. They demonstrate an understanding of relationships involving...
Curated OER
Decimal Bingo
Practice converting decimals into fractions. They draw a 3x3 grid and write in any nine common fractions with denominator 10 or 100 and with numerators 9 or less. The group listens as the teacher call out decimal numbers within the given...
Curated OER
Fraction Benchmarks
Learners investigate the fraction benchmarks for zero, one half, and one. They use these benchmarks to compare the relative sizes of fractions, through estimating, ordering and placing them on a number line. An assessment worksheet is...
Curated OER
Time Management
Students record their daily activities and graph the results using the educational software program called Inspiration. This instructional activity is intended for the upper-elementary classroom and includes resource links and activity...
Curated OER
Videobusters
A real-world scenario, Videobusters, a video rental store has just got to get organized. In small groups, the class works on organizing and analyzing data utilizing matrices. They need to use their skills in adding, subtracting and...
Curated OER
A Statistical Study of the Letters of the Alphabet
Students gather appropriate information for simple statistical analysis. Then they will calculate probability working with a piece of literature that makes this instructional activity ideal for teaching across the whole curriculum.
Curated OER
The Price is Right
Learners, through various activities, explore online databases. Using the internet, students explore the distributors websites. They collect specific information on selected products. An spreadsheet with price comparisons is developed....
Illustrative Mathematics
Quinoa Pasta 1
Here is a great opportunity to introduce your mathematicians to a food they may never have heard of, quinoa. It may help to show a short video on quinoa, or make some quinoa for the class to try. Once they get over how to say quinoa,...
Curated OER
From a Square to a Rectangle
Eighth graders solve problems involving percentage increases and decreases. Using given percentages, 8th graders transform a square into a rectangle. They apply the area formulas for squares and rectangles.Students observe the percent...
Curated OER
Bubble Gum Chemistry
Students explore the concept of graphing data. In this graphing data lesson, students determine the percentage of sugar in bubble gum. Students graph type of gum vs. sugar percentage. Students create a table of their data.


