Curated OER
Get a Half Life!: Student Worksheet
Upper elementary or middle schoolers will explore non-linear functions, graphing, and the curve of best fit through real-life data collection and trial analysis. They explore the concept of half-life and radioactive decay using M&Ms,...
Curated OER
Multiples of 6 #2
Count by six with these helpful activities. After completing number sequences and multiplication problems from the six times table, third graders solve problems that are written out at the bottom of the page. An excellent way to work on...
Curated OER
Review Graphing Parabolas & Circles
Students review how to graph parabolas. They practice graphing two different parabolas using the vertex and table method. They solve problems related to graphing circles, determining the radius and the center.
Illustrative Mathematics
How Many Colored Pencils?
Support young mathematicians' interpretation of place value in order to multiply single-digit numbers by 10. The task builds upon and enhances a learners' understanding of place value, a second grade skill, while introducing...
EngageNY
Tax, Commissions, Fees, and Other Real-World Percent Problems
Pupils work several real-world problems that use percents in the 11th portion of a 20-part series. The problems contain percents involved with taxes, commissions, discounts, tips, fees, and interest. Scholars use the equations formed for...
PBL Pathways
Medical Insurance 2
Make an informed decision when choosing a medical insurance provider. An engaging lesson asks your classes to write piecewise models to represent the cost of different medical plans. The project-based learning activity is a variation of...
PBL Pathways
Medical Insurance 3
Create a technical report explaining the components of a medical plan through a function. The project-based learning activity gives a medical insurance scenario that young mathematicians model using piecewise functions. Their analyses...
Curated OER
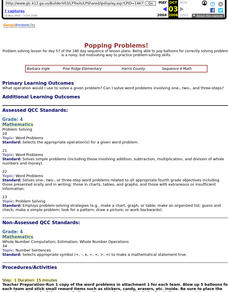
Popping Problems!
Turn your math lesson into a carnival game with this fun, outdoor activity. After reviewing the concept your class will be practicing briefly, split your class up into teams and head outdoors. These teams work to solve math questions and...
Beacon Learning Center
Line Plots
Introduce line plots, show examples of tables, graphing on a number line, and engage in a class discussion. Share the process by which statistical data is organized and displayed on a number line. Examples and worksheets are included....
Curated OER
Exploring Renewable Energy Through Graphs and Statistics
Ninth graders identify different sources of renewable and nonrenewable energy. In this math lesson, learners calculate their own carbon footprint based on the carbon dioxide they create daily. They use statistics to analyze data on power...
EngageNY
Comparing Linear and Exponential Models Again
Making connections between a function, table, graph, and context is an essential skill in mathematics. Focused on comparing linear and exponential relationships in all these aspects, this resource equips pupils to recognize and interpret...
EngageNY
The Most Important Property of Logarithms
Won't the other properties be sad to learn that they're not the most important? The 11th installment of a 35-part module is essentially a continuation of the previous instructional activity, using logarithm tables to develop properties....
Curated OER
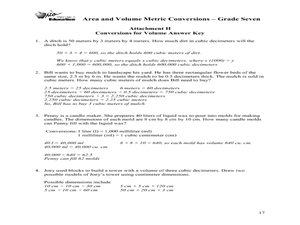
Area and Volume Metric Conversions - Grade Seven
Students investigate unit conversion. In this unit conversion lesson, students will build models of square and cubic centimeters using grid paper and generate formula tables for converting units of area and volume. The tables...
Illustrative Mathematics
Counting Overview
Develop automatic, meaningful counting skills with your class by using everyday classroom/school items, objects, and opportunities. Counting skills should be practiced during the year using objects and items they are familiar with and...
Curated OER
Interactivate: Introduction to Functions
This interactive website provides a variety of lesson plans according to which standards you are applying and which textbook you use. Introduce functions to your class by having them construct single operation machines and create...
PBL Pathways
Medical Insurance
Design a plan for finding the best health insurance for your money. Learners compare two health plans by writing and graphing piecewise functions representing the plan rules. Using Excel software, they create a technical report...
EngageNY
Probability Distribution of a Discrete Random Variable
Learn how to analyze probability distributions. The sixth installment of a 21-part module teaches pupils to use probability distributions to determine the long-run behavior of a discrete random variable. They create graphs of probability...
CK-12 Foundation
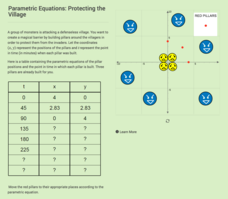
Parametric Equations: Protecting the Village
Determine the location of the pillars in time. Given a table of values for two parametric equations, pupils complete the table to determine the location and time it takes to build the pillars. Learners plot the points representing...
Curated OER
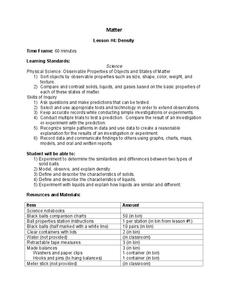
Density
Learners predict when an object will float or sink based on comparison of density of the object to the density of the substance in which it is placed. The access a website and sketch the object in the first column of their table and then...
Curated OER
Lesson Plan 2: Hot Dog Sales - Solving Linear Equations and Inequalities
This lesson will provide learners with an introduction to solving equations and inequalities numerically (using a table), graphically, and algebraically. they devise a table that would produce information about the number of hot dogs...
Curated OER
Shaquille O'Neal Hand/Foot Span: Student Worksheet
Here's a clever math worksheet that has learners measure their hand span, foot length, come up with a ration, then use that information to figure out the hand span, and foot length of basketball giant Shaquille O'Neal. A good activity!
Curated OER
Statistics Canada
Students practice using graphing tools to make tables, bar charts, scatter graphs, and histograms, using census data. They apply the concept of measures of central tendency, examine the effects of outliers. They also write inferences and...
Curated OER
Do These Systems Meet Your Expectations
This lesson is all about systems of equations and their graphs. Algebra learners create and solve systems of equation using tables and graphing. They identify the point of intersection of a system of equation, and discover what the...
Curated OER
Days and Seasons
Introduce young scholars to calendars as they practice the days of the week and four seasons. First graders complete three days-of-the-week sequences, each starting on a different day. They can reference the completed sequence example...


