Earth Watch Institute
Entering Local Groundhog Data in an Excel Spreadsheet
Here is a cross-curricular ecology and technology lesson; your learners create spreadsheets depicting the location and number of groundhog dens in a local park. They research groundhogs and analyze data about where the groundhog...
Special needs in Music
Music Work Sheet (Special Ed)
Music is beneficial for all learners. Help your learners with special needs learn about different styles of music, as well as the ways that music is represented on paper, with 30 different worksheets.
Reed Novel Studies
Lawn Boy: Novel Study
A mountain of grass becomes a mountain of cash in the case of a young entrepreneur in the novel Lawn Boy. Arnold, a main character, begins a lawn mowing business and meets a stockbroker client that helps me manage his money....
Curated OER
Learning the Multiplication Facts - Part 2
The teaching of multiplication facts is the focus of this presentation. The author conveys a variety of "tricks" in the presentation which are meant to help students remember their times tables. To me, the "tricks" are rather confusing,...
Curated OER
Multiplication BINGO
Students receive a multiplication BINGO card. Students are given the answers to the fact cards that may be given during the game. Students arrange these answers in random places on their BINGO board. As each fact card is shown, students...
Virginia Department of Education
Numbers in a Name
What's in a name? Pupils create a data set from the number of letters in the names of classmates. Each group then takes the data and creates a visual representation, such as a histogram, circle graph, stem-and-leaf plot, etc.
Curated OER
Graphing Quadratic Equations with a Coefficient of One
This is a teacher page for a lesson and does not include any materials to support the lesson. Students graph quadratic equations with a coefficient of one and create a table of values to graph a quadratic equation. They plot the values...
Curated OER
Addition Patterns
Use a learning activity with your youngsters in order to establish an understanding of patterns in a small addition table. Help learners recognize that adding two odd numbers will produce an even number, and adding two even numbers will...
Curated OER
Data Lesson Vital Information
Students prepare and collect data and use excel and create a graph. They collect data about the number of pattern blocks that are put on tables. Students then record that data in Excel.
Curated OER
Pizza Possibilities
Pupils create and interpret line plots, bar graphs, and circle graphs. The lesson assumes mastery of conversions from fraction to decimal to percent, construction of angles, and at least an introduction to graphs displaying data.
Curated OER
A Picture is Worth a Thousand Words: Introduction to Graphing
Students practice graphing activities. In this graphing lesson, students discuss ways to collect data and complete survey activities. Students visit a table and graphs website and then a create a graph website to practice graphing.
Curated OER
"How Many Names for 100?"
Fifth graders work on the different possibilities of reaching the number 100. The class is divided into homogeneous groups for cooperative learning. The lesson uses discussion questions to help with problem solving.
Curated OER
Adding and Subtracting Algebraic Expressions (Combining Like Terms)
Everyone loves math when it includes food! This lesson tries to take the notion of combining like terms in algebra and comparing it to sorting apples and oranges. It takes a step-by-step approach to helping students understand this...
Curated OER
Probability Experiment Simulation: Design and Data Analysis Using a Graphing Calculator
Seventh graders simulate probability experiments. Using a graphing calculator, 7th graders design, conduct, and draw conclusions from simulations or probability experiments. Students construct frequency tables and compare the...
Curated OER
Virtual Field Trip
Are we there yet? Young trip planners learn about their state and plan a trip. They will select sites to see in three cities in their state, and record associated costs in a spreadsheet. While this was originally designed as a...
Illustrative Mathematics
Extending the Definitions of Exponents, Variation 1
Scientist work with negative integer exponents all the time. Here, participants will learn how to relate negative exponents to time and to generate equivalent numerical expressions. Learners will apply the properties of integer exponents...
Curated OER
Ocean Life: A Heavy Subject
Second graders examine The Learning Page Fact Files about ocean life and categorize the data by weight and group. They distinguish between fish, mammals, and invertebrates and which weigh the most and the least. Students record their...
Alabama Learning Exchange
Mix it Up! Exploring the Commutative and Associative Properties of Addition
Examine commutative and associative properties with your class. They'll explore the relationships between addition and subtraction and investigate patterns as they solve addition problems. Links to an assessment and a table game are...
Curated OER
Fabulous Fractals
Students view a video to discover how patterns in nature relate to math. They explore the concept of exponential growth by observing and creating fractals. They solve and design word problems.
Curated OER
Why Doesn't My New Shirt Fit?
Students test Leonardo da Vinci's view of the human body by measuring various body parts using a tape measure. They create a data table and a scatter plot and then analyze and interpret the results using a graphing calculator.
Illustrative Mathematics
Operations with Rational and Irrational Numbers
Learners complete addition and multiplication tables that include rational and irrational numbers. They also answer a series of questions about the sums and products of irrational and rational numbers. One suggested modification would be...
Curated OER
Analyzing Discrete and Continuous Data in a Spreadsheet
You are what you eat! Your statisticians keep a log of what they eat from anywhere between a day to more than a week, keeping track of a variety of nutritional information using a spreadsheet. After analyzing their own data, individuals...
Curated OER
Patterns and Algebraic Expressions
Scholars will solve problems, create patterns, and write algebraic expressions. In addition, they will learn how to represent a number with a variable.
Virginia Department of Education
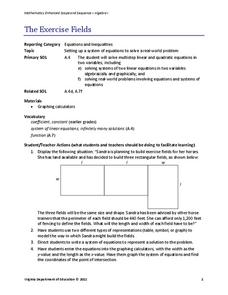
The Exercise Fields
Horses need exercise, too. Scholars create linear equations to model the perimeter of exercise fields for horses. They finish by solving their equations for the length and width of the fields.


