Curated OER
The Calculus Whiz Who Owned a Box Company
Learners use the relationship between volume and surface area to construct a box out of a piece of paper that maximizes volume using a table and by using graphing and calculus techniques.
Curated OER
Mr. Cobbler's Shoe Dilemma
Students employ statistics to solve real-world problems. They collect, organize and describe data. They make inferences based on data analysis. They construct, read, and interpret tables, charts and graphs.
Curated OER
Storefront Signs
Learners practice finding the areas and patterns within a square and explore the concept of quadratic functions. They observe and record the area values in a table, plot a graph of Area versus Distance and complete a variety of student...
Curated OER
Smarties Investigation
In this math worksheet, students complete a variety of activities using Smarties candy. For example, students estimate the number of each color, count the actual amount, and record their results in a tally chart.
Curated OER
Making Connections
Seventh graders relate patterns with higher math. In this 7th grade math lesson, 7th graders analyze different methods of portraying data. They relate the data to real life scenarios.
Curated OER
Creating Line Graphs
High schoolers draw line graphs. In this math instructional activity, students interpret minimum wage data and graph the data in a line graph. High schoolers predict the next minimum wage and figure the earnings for a 40 hour work week...
Curated OER
Probability Two Events
Students investigating the concept of probability practice the concept using a variety of different example problems. The lesson is delivered in a question and answer format. The frequency of answers is recorded in a data table for...
Curated OER
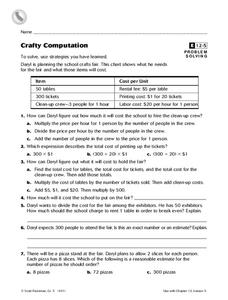
Crafty Computation
In this problem solving worksheet, 5th graders look over a table with information relating to 3 items needed at a crafts fair and the cost of each one. Students answer 4 questions with multiple choice answers and 3 short answer questions.
Curated OER
Activity Plan Mixed Ages: Exploring Play Dough
Students learn to prepare a play dough recipe in order to enhance their measurement, reading, and creative-thinking skills. In this lesson on making play dough, students measure and add the different ingredients, while simultaneously...
Curated OER
Maps and Lines
In these organizing data worksheets, 5th graders complete four worksheets of activities that help them learn maps, graphs, and lines. Students then study images of maps, lines, and graphs.
Curated OER
Create and Analyze Rectangular Patterns
Students explore the concept of geometric patterns. In this geometric pattern instructional activity, students use Microsoft Excel to explore geometric patterns. Students analyze growth rates of pattern growth. Students create their...
Curated OER
What's My Function?
Fifth graders utilize input/output tables to help them solve algebraic equations. They incorporate patterns, number sequences and relations to represent and analyze mathematical problems and number relationships using algebraic symbols.
Curated OER
Making Movies
Students use interactive white boards to solve math problems. In this math problems lesson plan, students produce math casts where they can solve problems, write out descriptions, and communicate what they know and do not know on the...
Curated OER
Graphing and the Coordinate Plane
Students learn about the Cartesian coordinate plane, understand the four quadrants of the Cartesian coordinate plane, and plot points on the plane. Students read coordinates for a point from a graph and give the ratio of rise over run...
Curated OER
Area and Perimeter
Students discover and apply the formula for the area and perimeter of rectangles and squares. They draw the shapes on graph paper and create tables that include their information.
Curated OER
Managing Nutrients in Livestock Manure
Livestock managers reinforce math and science skills while learning about the nutrients found in manure. They predict which animal produces the largest amount and which animal's manure contains the most nitrogen. Finally, they compare...
Curated OER
Keep Those Expressions in “Orderâ€
In this operations worksheet, students write a problem, fill in the PEMDAS table, and simplify any parenthesis first. Then they simplify any powers and perform multiplication, division, addition, and subtraction if necessary.
Curated OER
Alternative Energy Part II - Lesson Eight of Eight - Energy Conversion and Propulsion
Students investigate the results of different propulsion methods. In this propulsion lesson, students measure the distance a test toy car goes using different types of propulsion. They record the distances in data tables before...
Curated OER
Jumping in the Air - What was your Height?
Students solve equations using the quadratic formula. In this quadratic equations lesson, students use digital cameras to film students jumping and import film clips into a computer. Students use the data in the quadratic formula...
Curated OER
Graphing Quadratic Functions
Students graph quadratic functions. In this algebra lesson, students identify the vertex and intercepts of a quadratic equations and graph the parabola. They find the axis of symmetry and make a table to find the values of the parabola.
Curated OER
Data Analysis Digital Display
Learners create a survey online. In this math lesson, students graph survey data using flisti.com. They share and analyze their classmates' histogram.
Curated OER
Linear Functions: Are You Ready for the REAL World?
students emulate a real world problem and model it with mathematics working in a small group. Observe and facilitate discussion as the groups use various strategies, such as (graphs, brainstorming, tables, and dialogue.
Curated OER
Rainbow Jelly
Students work with teaspoons, tablespoons and fractions of a cup to make their own rainbow jelly, converting between units of volume as required. They recognize the need for a standard unit of volume and measure volume using teaspoons...
Curated OER
Party, Party, Party
Second graders conduct investigations with counting, comparing, organizing, analyzing, displaying and interpreting data. They pose questions for investigation and collect the data. Students display the data in tally charts, uniform...


