Curated OER
Graphing Linear Equations
In this calculator active graphing worksheet, students graph 12 equations via a calculator and transfer the graphs onto coordinate grids.
Curated OER
What Do We Do With A Dirty Bomb?
Students examine composition of dirty bomb and its possible effects on a city, and investigate simulations of such an event; students use computational and problem solving skills to assess damage and prepare report proposing solution to...
Curated OER
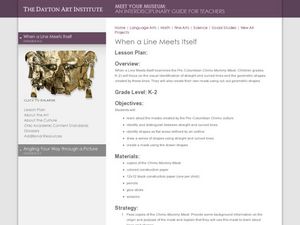
When A Line Meets Itself
Students investigate the linear characteristics of cultural art. In this art analysis lesson, students discover the Pre-Columbian Chimu culture and the many masks they created. Students identify the different shapes and lines...
Curated OER
Exploring Linear Equations And Scatter Plots - Chapter 5 Review
Young scholars complete rolling stocks experiment, and collect and enter data on the computer. They enter data on graphing calculators, complete scatter plot by hand with line of best fit, and discuss different graphing methods.
Curated OER
The Stained Glass Window
Students use centimeter rulers and the attached worksheet containing a scale drawing of a stained glass window. The actual measurements of the stained glass window are given, and students are asked to find the actual measurement of the...
Curated OER
ART PROJECT
Eighth graders, after researching the properties of graphs of conic sections, absolute value and inverse relations, make a drawing of precise functions and relations from a specified list of equations. The final design should analyze the...
Curated OER
Graphing Data
Second graders graph data about their classmates. In this data analysis lesson, 2nd graders ask each other several questions about their hair color and eye color. Students graph the data that they collected.
Curated OER
River Optimization Problem
Students define the different methods used for optimizing a particular element of a problem. In this optimization problem lesson, students optimize appropriate details of a problem using data collection, algebra, technology, and/or...
Curated OER
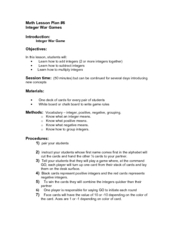
Integer War Game
Review adding, subtracting and multiplying integers using this activity. Learners play a game using a deck of cards in which the black ones are positive and the red ones are negative. They add, subtract, etc . . . based on the...
Curated OER
Visual Models of Solutions and Concentrations
Learners model solutions with beakers of colored glass or plastic spheres. In this solutions lesson, students use beakers of colored spheres to represent pure substances. They mix the spheres to demosntrate solutions. They discuss...
Curated OER
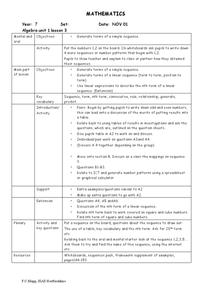
Simple Sequence
Students identify the nth term in a sequence. In this algebra lesson, students generate sequences given the formula for each sequence. They find the formula given the sequence.
Curated OER
Sequences and Linear Equations
Students identify the formula to find the nth term. In this algebra lesson, students finish a pattern and identify missing parts in a sequence. They write an equation given a partial sequence.
Curated OER
Creating a Spreadsheet
Students create a spreadsheet using ICT. In this algebra lesson, students collect and graph their data using a spreadsheet. They find solution to a given problem using trial and error.
Curated OER
Graphing Linear Equations with Two Variables
Can your class solve linear equations in two variables? They will be able to after they engage in this lesson. Individuals graph linear equations in two variables using slope and intercept and identifying the relationship between the x...
Curated OER
Products, Multiples, Factors
In this products, multiples, and factors worksheet, students complete various activities where they solve problems for products, multiples, and factors of numbers. Students complete 14 problems.
Curated OER
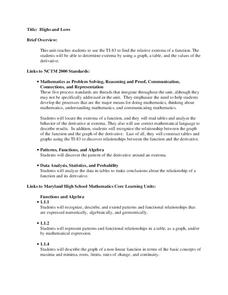
Highs and Lows
Solve problems using integration and derivatives. By using calculus, learners will analyze graphs to find the extrema and change in behavior. They then will identify the end behavior using the derivatives. Activities and handouts are...
Curated OER
Interpreting Data from Birdfeeders
What kinds of birds live in your area? Read a book about birds to your learners and explore their feeding patterns. Charts and graphs are provided in this three page packet, but consider assigning the basic questions if using with young...
Alabama Learning Exchange
Systems on a Mission
Solve systems of equation problems using four different methods: elimination by addition or subtraction, graphing, elimination by multiplication, and substitution. Middle schoolers are then given a series of "missions" to complete.
Curated OER
Block Heads
Students demonstrate whole numbers through one thousand using base ten blocks. They model and describe given numbers using ten blocks.
Curated OER
What's in a Graph?
Students explore how to use and interpret graphs. The graphs are pulled from a variety of sources, and the activities ask students to interpret graphs. They start this lesson with knowledge of what a graph is. Students also know how to...
Curated OER
Probability - Explore and Tabulate
Upper elementary and middle schoolers explore the concept of probability. In this probability instructional activity, pupils flip coins and draw chips out of a bag to determine the likelihood of a particular outcome. They perform the...
Curated OER
Data
Students collect data from an experiment they perform. For this data lesson, students use multiple representations to solve practical problems; describe advantages and disadvantages of the use of each representation. Then, they evaluate...
Curated OER
Exploring Exponential Growth and Decay Functions
Learners differentiate between exponential growth and decay. In this algebra lesson, students solve exponential equations using properties of exponents. They use the Ti calculator to graph and analyze their functions.
Curated OER
Box Plots
Young statisticians are introduced to box plots and quartiles. They use an activity and discussion with supplemental exercises to help them explore how data can be graphically represented.


