Willow Tree
Graphing
So many methods and so little time! The efficient method of graphing a linear equation depends on what information the problem gives. Pupils learn three different methods of graphing linear equations. They graph equations using...
Willow Tree
Histograms and Venn Diagrams
There are many different options for graphing data, which can be overwhelming even for experienced mathematcians. This time, the focus is on histograms and Venn diagrams that highlight the frequency of a range of data and overlap of...
Rice University
Introductory Statistics
Statistically speaking, the content covers several grades. Featuring all of the statistics typically covered in a college-level Statistics course, the expansive content spans from sixth grade on up to high school. Material...
Curriculum Corner
8th Grade Math "I Can" Statement Posters
Clarify the Common Core standards for your eighth grade mathematicians with this series of classroom displays. By rewriting each standard as an achievable "I can" statement, these posters give students clear goals to work toward...
Curated OER
The Value of Education
Money is always a great motivator. Give the class a set of statistics regarding yearly annual wages with the corresponding level of completed education. Even if they think college is silly, they'll consider it when they realize how much...
EngageNY
The Motion of the Moon, Sun, and Stars—Motivating Mathematics
What does math have to do with the behavior of the earth and sun? Learn how the movement of celestial bodies has influenced the development of trigonometry. Scholars connects the details in mathematics to their...
Bowland
Speed Cameras
Do speed cameras help reduce accidents? Scholars investigate this question using a series of spreadsheet activities. Along the way, they learn about randomness, probability, and statistical analysis.
Curated OER
Practice the 7s
Get those mental mathletes thinking on their toes! Can they recall multiples of seven in these timed exercises? Scholars who have already learned multiples of seven get some timed practice as they finish this 60-problem set. They...
Mathematics Vision Project
Module 7: Modeling with Geometry
Model good modeling practices. Young mathematicians first learn about cross sections and solids of revolution. They then turn their attention to special right triangles and to the Laws of Sine and Cosine.
Curated OER
Reading Bar Graphs #2
Raise the bar in your third grade class with this learning exercise on bar graphs. Youngsters view three graphs representing three different sets of data, and answer questions based on what they analyze. The first set is completed as an...
Mathematics Assessment Project
Patchwork
Sew up learning on writing rules for patterns with an assessment task that has pupils investigate the number of triangles needed for cushions of different sizes. They then use the data to generate a rule for a cushion of any size.
Didax
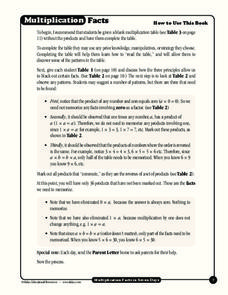
Multiplication Facts
Learning their multiplication facts is a big step in the education of young mathematicians. Help achieve this goal with the support of this collection of instructional materials.
Curated OER
Learning the Times Tables: Guidelines And Ideas for Practice
Students observe and demonstrate a variety of techniques for learning their times tables. They check their answers on a calculator, create flashcards and a number line, develop a number chart from 1-100, write times table story...
Curated OER
Using a Multiplication Table
Third graders study introducing the concept of using a multiplication table. In this multiplication facts lesson, 3rd graders use the table to fill in the products for the factors zero to five and ten.
Curated OER
Kitchen Math For Preschoolers
Students turn kitchen time into learning time. Parents can use opportunities abound at home using "real" objects to teach beginning math. When learning begins with real objects and experiences, children use all of their senses-thus...
Curated OER
Tables Grids
In this tables grid worksheet, learners complete a multiplication grid. In this fill in the blank worksheet, students write products for thirty-six facts.
Curated OER
Multiplication Tables Grids
In this finding the products worksheet, students observe a multiplication explanation and example and multiply times two, three, five, and ten to complete a multiplication table grid. Students fill in 36 squares.
Curated OER
Tables grids
In this multiplication worksheet, students learn how to fill out a multiplication tables grid. They then complete the one in the packet, which has 36 blanks to fill in. The answers are on the last page.
EngageNY
Why Were Logarithms Developed?
Show your class how people calculated complex math problems in the old days. Scholars take a trip back to the days without calculators in the 15th installment of a 35-part module. They use logarithms to determine products of numbers and...
Kenan Fellows
Dinner Party: Using Pattern Trains to Demonstrate Linear Functions
Nothing fancy here ... just your run-of-the-mill Algebra party! Learners explore the patterns of linear functions while designing seating arrangements for a dinner party. Comparing the number of tables to the perimeter of the combined...
ARKive
Handling Data: African Animal Maths
Handling and processing data is a big part of what real scientists do. Provide a way for your learners to explore graphs and data related to the animals that live on the African savannah. They begin their analysis by discussing what they...
Curated OER
Making a Ten
An addition table supports third graders as they learn strategies to improve their math fluency. When finding sums greater than ten, students are taught how to first make a ten and then add on the rest. A similar method is also...
CK-12 Foundation
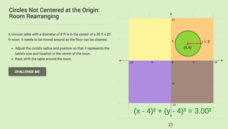
Circles Not Centered at the Origin: Room Rearranging
Where does a circular table fit best? Individuals move a circle representing a table into different quadrants of a room. Pupils determine which equation of the circle will place the table in the appropriate quadrant. A discussion...
Concord Consortium
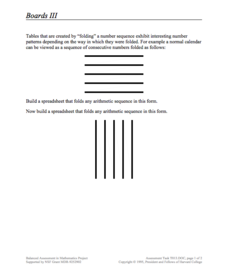
Boards III
Learn to visualize mathematical patterns as a folded pattern. Beginning with a visual display, the task encourages pupils to view sequences as a folded table. The pattern of the table then becomes a formula in a spreadsheet that...


