Curated OER
The Sunspot Cycle-Endings and Beginnings
In this sunspot cycle worksheet, students use a graph of the sunspot numbers from January of 1994 to January of 2008. Students solve 8 problems using the data in the graph to determine the maximum occurrence of sunspots, the minimum...
Curated OER
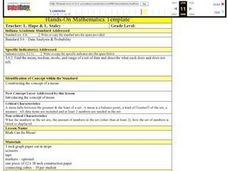
Mean, Median and Mode
Fourth graders describe weather data using the mean, median and mode. In this mean, median and mode lesson, 4th graders understand how to calculate data using mean, median and mode and why they would use each one.
Worksheets Plus
Place Value Worksheets - Comparing Numbers
Six problems consisting of sets of tens and ones cubes are arranged for aspiring mathematicians to analyze. For each problem, pupils write down the total numbers of cubes and then use < or > to identify which set is the least and...
Curated OER
The Snow Problem
In this snow problem instructional activity, students examine clues to determine the snowfall in designated years. They list the snowfall in order from greatest to least. This one-page instructional activity contains 1 problem. The...
Curated OER
Math Assessment: Counting, Ordering, Writing Number Sentences
In this math assessment worksheet, students complete a 6 question quiz with a variety of skills. Included skills are ordering from greatest to least, writing number sentences to match a picture, and subtraction with borrowing.
Curated OER
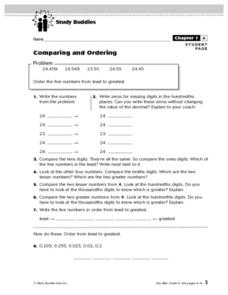
Comparing and Ordering (Decimal Numbers)
In this math worksheet, learners learn to compare and order five numbers in a set. Numbers are decimals to the thousandths place. Students answer 8 questions. There are also activities which can be done with a partner.
Curated OER
Math Can Be Mean!
Fifth graders are introduced to the topic of means. Calculating the mean, mode and median, they describe what each set of numbers tell and do not tell about the data. They use a line graph to practice finding the mean. They also use...
Curated OER
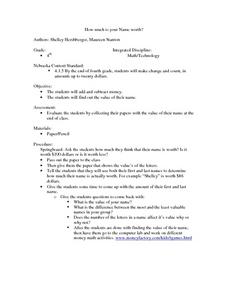
How Much is Your Name Worth?
Students identify the value of each coin type and then use a code to assign each letter of the alphabet to the value of the coins. They add coin combinations to determine the value of their name.
Curated OER
Piece of the Sky: Introduction for Making S'COOL Observations
Learners observe and discuss cloud cover. They identify percent of cloud cover, calculate cloud cover by fraction and convert to a percent, and compare their models with the current real sky cloud cover.
Curated OER
Math: Reaching New Heights
Students apply math skills to assess the range, mean, mode, and median of data sets. Using a "Reaching New Heights" worksheet, they review and discuss how to calculate the answers. Students write complete explanations of all their...
Curated OER
100 More 100 Less
Third graders review the concept of place value and number sense. With a partner, they are given four cards with numbers on them. Using the cards, they practice making new numbers and completing addition and subtraction to find the...
Curated OER
Plotting with Pennies
Fifth graders use pennies to gather data, organize and order data, graph the data on a stem-and-leaf plot, and evaluate the range, median, and mode of the data.
Curated OER
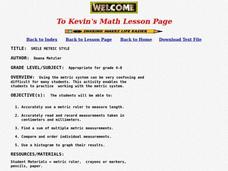
Smile Metric Style
Students practice working with the metric system. Students use a metric ruler to measure and record lengths of group member's smiles, and graph their results. Students find the sum of all the smiles.
Curated OER
Smile Metric Style
Pupils take measurements using a metric ruler, find a sum of multiple metric measurements, and use a histogram to graph their results.
Curated OER
Plotting Amish Farmland
Second graders listen to the book, Down Buttermilk Lane by Barbara Mitchell. They discover how to read a grid and then together as a class, plot 2 squares, one yellow and one green. Then they plot the remaining squares independently and...
Curated OER
Solving Percent Problems with Proportions
Seventh graders explore the concept of percent problems. In this percent problem instructional activity, 7th graders use proportion equations to solve percent problems. Students find percentages of numbers and use proportions to...
Curated OER
Mean, Median, and Mode
Students calculate the mean, median, and mode in a set of numbers. In this data analysis lesson, students put a set of numbers in ascending order and perform calculations to find the mean, median, and mode.
Curated OER
Kinetic Energy and Work
Students study kinetic energy and how it works. In this investigative instructional activity students divide into groups and attempt to break a board with their hand.
Curated OER
Rational Expressions
In this algebra worksheet, students identify the greatest common factor to simplify equations. They cancel out GCF to reduce rational expressions. They find the LCD for addition and subtraction problems.
Curated OER
Pair Up
In this number sense learning exercise, 1st graders focus on place value as well as greater than and less than. Students complete 4 problems using the given numerals to create different numbers and finding that which is the greatest and...
Curated OER
What Is Perimeter?
In this geometry worksheet, students read the definition of and the algorithm for finding the perimeter of a rectangle. They find the perimeter of 8 rectangles before ordering 4 items from the greatest perimeter to the least.
Curated OER
Building Venn Diagrams
Young scholars use Venn diagrams to solve prime number and factorization problems. In this multiplication lesson, students watch a video and use a Venn Diagram to help them solve a pizza math activity that uses prime factorization. Young...
Curated OER
How Big Is That Star?
Aspiring astronomers study stars. They compare stars and explain the relationship between radius, mass, and diameter. By creating a star simulation, they discover how a binary star system's orbit can cause changes in the observed...
Curated OER
Divisibility Rules
Eighth graders explore Excel and discover rules of divisibility for the numbers 2, 3, 4, 5, 6, 9, and 10; students examine multiples of 2 using pencil/ paper, then create a chart in Excel that will allow them to more easily see patterns...
Other popular searches
- Least to Greatest Number Order
- Greatest to Least
- Fractions Least to Greatest
- Decimals Least to Greatest
- Math Least to Greatest
- Least to Greatest Numbers
- Greatest to Least Integers
- Decimal Greatest to Least
- Ordering Greatest to Least
- Fractins Least to Greatest
- Greatest to Least, Intergers
- Order From Least to Greatest


