UAF Geophysical Institute
System Interactions: The Lorax and the Truffula Tree
If the Lorax were to write a letter, what would he write? Introduce your class to systems and feedback loops through the whimsical stylings of Dr. Seuss. Learners take on the Lorax's point of view to write a letter, among other activities.
Mathematics Assessment Project
Sampling and Estimating: Counting Trees
Your task today: count all the trees on a tree farm. To complete the assignment, learners first estimate the number of trees on a tree farm using random sampling. To improve their own response they then evaluate provided...
Kenan Fellows
Climate Change Impacts
Turn up the heat! Young mathematicians develop models to represent different climates and collect temperature data. They analyze the data with regression and residual applications. Using that information, they make conclusions about...
Louisiana Department of Education
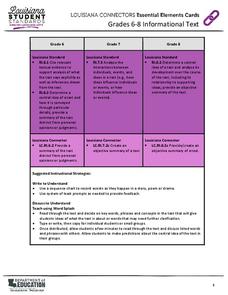
Essential Elements Cards
Use essential elements cards to help lesson plan! Each card contains an informational text common core standard for grade levels six through eight and suggestions for activities and supports. Cards address skills such as citing textual...
Curated OER
Moon Mining
Go on a moon mining expedition from the safety of your classroom with this space exploration simulation. Using simple models of the moon's surface prepared ahead of time by the teacher, young scientists are challenged with locating and...
Statistics Education Web
You Will Soon Analyze Categorical Data (Classifying Fortune Cookie Fortunes)
Would you rely on a fortune cookie for advice? The instructional activity first requires future statisticians to categorize 100 fortune cookie fortunes into four types: prophecy, advice, wisdom, and misc. The instructional activity goes...
National Park Service
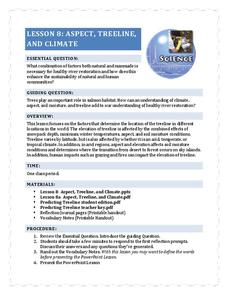
Aspect, Treeline, and Climate
Head to the treeline and beyond to examine how this feature of the landscape affects weather and climate, which gives scientists clues about its health. Class members' observations of photographs provide the data...
Houghton Mifflin Harcourt
Songwriting Skill - Choosing a Tone: Jordan Pruitt - “One Love”
"Tone means attitude." Or so says this resource that uses Jordan Pruitt's "One Love" to model for songwriters how to develop an attitude in their lyrics. Class members engage in a number of exercises designed to give them direct and...
American Statistical Association
Chocolicious
To understand how biased data is misleading, learners analyze survey data and graphical representations. They use that information to design their own plans to collect information on consumer thoughts about Chocolicious cereal.
University of Texas
Matter and the Periodic Table Chemical Families and Periodic Trends
Is assembling the periodic table as simple as Tetris? Scholars arrange colored cards into a logical order and then make connections to the arrangement of the periodic table. Hands-on activities include adding trend arrows and analyzing...
American Statistical Association
Happy Birthday to . . . Two?
How many people do you need in a room before two likely share the same birthday? Scholars consider this puzzle by analyzing a set of data. They ponder how to divide the data and determine the proper size of a group for this event to...
NOAA
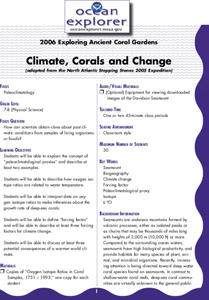
Climate, Corals and Change
Global warming isn't just an issue on land; deep ocean waters are also showing troubling signs. Young scientists learn more about deep water corals and the many recent discoveries researchers have made. Then they examine data related to...
Rainforest Alliance
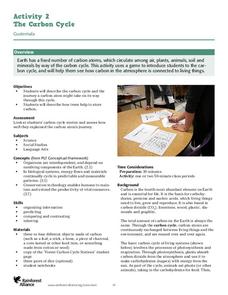
The Carbon Cycle
Scholars learn about the carbon cycle, play a carbon cycle game, and then write a story based on their role as a carbon atom during the game. After the writings, pupils analyze the carbon cycle by leading a class discussion on the material.
University of Georgia
Freezing and Melting of Water
Examine the behavior of energy as water freezes and melts. An engaging activity provides a hands-on experience to learners. Collaborative groups collect data and analyze the graphs of the temperature of water as it freezes and then...
Curated OER
Get the Joke!
Students explore humor through word context and inference used in everyday language.
Curated OER
Things Aren't Always What They Seem
Young scholars use video and the Internet to make predictions, draw conclusions, determine conflict and point of view while reading a short story. In this short story analysis instructional activity, students watch a related video and...
Curated OER
Making Inferences and Drawing Conclusions
Second graders make several inferences based on the reading of Shel Silverstein poems. They write their own poetry and complete an assessment in which they differentiate between sentences that are stated or inferred.
Curated OER
Asha's Village
Learners compare and contrast their own culture with an Indian girl named Asha. In this culture lesson plan, students read, look at pictures, and make inferences.
Curated OER
Measuring Snowfall
Students predict the amount of snowfall for the week and measure snowfall. In this measuring snowfall activity, student use a precipitation gauge to measure the week's snowfall; and analyze the data to determine whether or not...
Curated OER
Ornithology and Real World Science
Double click that mouse because you just found an amazing lesson! This cross-curricular Ornithology lesson incorporates literature, writing, reading informational text, data collection, scientific inquiry, Internet research, art, and...
Curated OER
The Water Cycle
Fifth graders explore the major components of the water cycle. They pay close attention to evaporation, condensation, and precipitation. A water cycle kit is set up in the classroom, which learners observe for a couple of days before the...
PBS
Does Art Imitate Life?
Write what you know, sound advice for any writer and something many famous authors are known to have done. Use these materials to explore how Shakespeare's life influenced his plays. This resource is packed with readings, video segments,...
KERA
Matisse and Picasso
Discover Modernism through the eyes of artists. Over the course of six well-thought-out lessons, learners examine works by Pablo Picasso and Henri Matisse while completing a range of collaborative and hands-on activities. A great resource!
Curated OER
Basic Excel
Students explore basic Excel spreadsheets. In this spreadsheet lesson plan, students enter Alaska weather information and perform calculations. Students title the columns on the spreadsheet and format the cells. ...


