Curated OER
Sending Messages to Space
Students interpret a message sent to space using a radio telescope and draw inferences from the interpreted message. Working with a partner, they interpret data that scientists believe is a message from aliens. They work on organizing...
Curated OER
Clouds
Students explore clouds. In this weather lesson, students identify the steps in the water cycle, define condensation and evaporation, and relate this information to cloud formation. Students perform a cloud experiment,...
Curated OER
Red, Green, and Blue Mystery Liquids! Hypothesis or Inference?
Eighth graders are actively involved in the scientific method and inquiry as they form quick hypotheses based upon a teacher set of mystery liquids. They determine the need to make additional observations of the liquids.
Curated OER
The Making of an Organ
Students examine and research how cells make up our organs. They create a model of a tongue showing cells, tissues and the organ.
Curated OER
Walking on Frozen Ground
Students listen to an Elder speak about permafrost structures in their area. For this permafrost lesson plan, students listen to the guest speaker, take a tour outside to view permafrost structures, and draw them.
Curated OER
Civil War: The North History Lesson
Students demonstrate their reading comprehension skills, including reading strategies, inference, literal meaning, and critical analysis.
Curated OER
Harriet Tubman: Dancing on the Freedom Trail
Young scholars observe a dance interpretation about Harriet Tubman. In this art/social studies lesson, students explore how their emotions can be expressed through movement and create their own dance or dramatic interpretation.
Curated OER
Who is on that Bill? Alexander Hamilton and the Federalist Papers
Students, who are adult learners, participate in an Internet scavenger hunt in order to assimilate information about the biography of Alexander Hamilton and the Federalist Papers. They look at the Federalist and Anti-Federalist Papers...
EngageNY
Using Sample Data to Compare the Means of Two or More Populations II
The 23rd segment in a series of 25 presents random samples from two populations to determine whether there is a difference. Groups determine whether they believe there is a difference between the two populations and later use an...
EngageNY
Using Sample Data to Compare the Means of Two or More Populations
Determine whether there is a difference between two grades. Teams generate random samples of two grade levels of individuals. Groups use the mean absolute deviation to determine whether there is a meaningful difference between the...
Curated OER
Multi-dimensional Modeling of Ore Bodies Making Sense of Empirical Data
Math scholars identify four different rock types in that strata and use this identification and data to construct a two dimensional geologic cross-section. They use data tables to construct a three-dimensional geologic cross-section.
Center for History Education
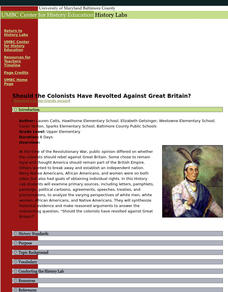
Should the Colonists Have Revolted Against Great Britain?
Should the Americans have taken the plunge and revolted against Great Britain? Using documents, including the famed Common Sense and a Loyalist response, pupils conduct a lengthy investigation of the question. The interesting resource...
Southern Nevada Regional Professional Development Program
Was Bias A Factor? Make an Argument
The ability to analyze an argument is a skill emphasized by the Common Core standards. Offer your class an opportunity to develop and hone their skills by providing them the testimonies in an Oregon court case. After reading the facts of...
Curated OER
Traveling With Limited Funds; A Tree Grows in Brooklyn
Students participate in a pre-reading activity which helps them see what it would be like to live in poverty. In this reading comprehension lesson, students make a list of items they take on a trip considering they have very limited...
Curated OER
A is for . . .
Students discuss the difference between making inferences and observations. They practice making observations and inferences regarding an apple.
Curated OER
Scientific Thinking
Young scholars participate in four different activities which reinforce an understanding of they way scientists think about the world. They make careful observations of two different pennies, write the procedure for making a peanut...
Curated OER
Project 1
Students are given a coin to observe and make inferences about. Using a worksheet, they make two columns to list their observations and inferences in an organized manner. They develop a hypothesis based on one of the inferences and...
Curated OER
During Reading Strategies
Students employ strategies to increase comprehension while they are reading. In this language arts lesson, students must infer, predict and visualize in order to improve comprehension.
Curated OER
Colors, Characters, & Clues
Students investigate inferences. They define inference, view a Powerpoint presentation, answer questions about a picture book, and identify clues throughout the story as examples of inferences.
Curated OER
Colors, Characters, & Clues: White Socks
Students examine the process of making inferences. They define inference, view a Powerpoint presentation, and as a whole group locate clues in the pictures of a short story, locating written clues to reinforce their conclusions.
Curated OER
The Fear Place
Students use the strategy turn and talk to discuss inferences they have while reading the book The Fear Place. In this inferences lesson plan, students answer discussion questions and read independently as well.
Curated OER
A'ama and Pipipi Adaptations
Learners explore ocean creatures. In this crustacean instructional activity, students determine how Black Nerite snails and Sally Light-foot crabs have adapted to their ocean habitats. Learners complete diagrams and hypothesize about the...
Pennsylvania Department of Education
Analyzing Key Ideas and Details in Nonfiction
Students explore nonfiction texts. In this language arts lesson, students read a nonfiction text and make predictions. Students identify facts and opinions in the text and draw conclusions as they read.
Curated OER
Jellybean Graphs
Second graders predict and graph data based on the color of jelly beans they think are in a handful. In this prediction lesson plan, 2nd graders will predict how many of each color jellybean are in a handful. Then they graph these...


