Curated OER
Epidemic Proportions
Students research epidemics that have devastated world population at various points in history. They share and calculate statistics obtained in their research and develop graphs comparing and contrasting how different epidemics affect...
Curated OER
A Statistical Look at Jewish History.
Eighth graders study the relationship between fractions, decimals and percentages by completing activities. In this research analysis lesson, 8th graders look at different websites to figure out Jewish populations in different situations.
Curated OER
Taste the Rainbow
Students practice estimating and graphing by utilizing Skittles. In this statistics lesson, students complete worksheets based on the likelihood of a certain color of skittle coming out of the bag. Students create a graph based on the...
Curated OER
Fractions
Fifth graders, after inventorying, add up the numerators of their fractions to see if it is the same number as the denominator. If it is, then they are ready to build whatever they wish, but using only what is in their individual inventory.
Curated OER
Tracking Your Favorite Web Sites
Ninth graders track the hit count on their favorite web sites. In this Algebra I lesson, 9th graders record the number of hits on their favorite web site for twenty days. Students explore the data to determine if the relation defines a...
Curated OER
Baseball Math Lesson Plans - Batter Up!
The game of baseball provides many opportunities for mathematical learning.
Curated OER
Making Blood!
students research blood's components, and use their math skills to recreate a model of whole blood using commonly found food items.
Curated OER
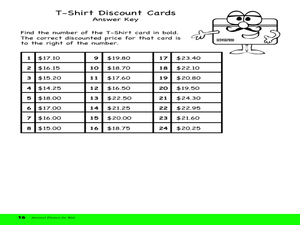
Computing Costs
Seventh graders calculate the out-of-pocket money needed to purchase a discounted item taxed at a certain percentage of sales tax.
Curated OER
Going Up Or Coming Down
Students find the percent of increase or percent of decrease. Through a teacher demonstration, they examine the methods of calculating percentages. Students solve real life problems.
Curated OER
What is for Sale and at What Price?
Seventh graders will research information on products carried by a store (such as sporting goods, department, clothing, etc.) They will create purchase prices for the products they wish to carry. They also will decide what percentage...
Curated OER
Skittles Lab
Students use Skittles as manipulatives to practice computing decimals from fractions, computing decimals into percentages, and creating bar graphs from gathered data.
Curated OER
Wise Shoppers
Pupils complete several activities to learn about currency and the functions of money. In this money functions lesson, students complete activities to learn what are the functions of money. Pupils calculate item prices with percentage...
Curated OER
GENDER BIASED WORD PROBLEMS
Learners identify word problems that show stereotyping and calculate the percentages.
Curated OER
Population Pyramids
Students create a population pyramid based on current data for their final project country. They analyze data from comprehension trends of final project country. Students analyze populations of specific countries.
Curated OER
Recycling
Students investigate how to reduce, recycle, and reuse items in order to conserve natural resources. They complete a trash graphing activity after discussing different types of trash. Finally, the examine ways to buy recycled products to...
Curated OER
Using Standard Deviation, part 2
Students explain and learn the practical application of standard deviation. They compare cities in the U.S. and discover whether cities closer to the ocean have more consistent temperatures. Useful resources are given.
Curated OER
Honey Bunches of Oats
Students explore a variety of crops that are used in our food products utalizing a box of the cereal, Honey "Bunches of Oates." Percentages of each of the three different kinds of flakes present are calculated.
Curated OER
Calculating Discounts and Sales
Young scholars discover that a discount is used by manufacturers and merchants to mean taking off a certain percentage of the price given in a price list. This price is called the list price. The list price less the discount is known as...
Curated OER
Balancing the Scales: Understanding Ratios
Students are introduced to the concept of ratios. In groups, they convert sets of numbers into a ratio. After practicing, they use the ratios and proportions to solve story problems. They also calculate map distances and discover map...
Curated OER
Different Perspectives of Oregon's Forest Economic Geography
Students map data on employment in wood products manufacturing in Oregon counties. In this Oregon forest instructional activity, students discover the percentage of people employed in the forest manufacturing industry. Students create a...
Curated OER
Introduction to Measuring the Forest
Students investigate how much wood is in a forest. In this forestry lesson plan, students calculate how much usable wood comes from the forest. They will read, Sizing Things Up from Trees + Me = Forestry, measure firewood piles, and...
Curated OER
Pizza Portions
Students explore mathematics by participating in a pizza pie activity. In this nutrition instructional activity, students identify the caloric intake in a piece of pizza and estimate the average number of slices eaten by a person....
Curated OER
Filling Empty Pockets: Borrowing, Loans, and Credit
Students examine credit components and how each works within our economy today. In this financial literacy lesson, students explore credit terms and make decisions based on real credit card offers that they find in their on line research.
Curated OER
Number: Fractions
Students explore equivalencies. In this decimals and fractions instructional activity, students examine number relationships and patterns as they compare whole numbers to decimals. Students complete a worksheet that requires them to...


