Curated OER
Store Wide Sale
Students practice figuring percentages by solving written shopping problems. In this consumer math lesson plan, students read several scenarios dealing with items on sale and must figure out the new price. Students check their work...
Curated OER
You Are Invited to Design and Build a Dream Room
Seventh graders watch a video and enlarge and shrink scale by applying proportional thinking. They practice measuring, using percentages, computing area, and problem solving.
Curated OER
Doing The School Run
Students explore finding the percent of a numbers. They survey their peers to determine modes of transportation used in getting to school. Afterward, students organize information and create graphs and charts. They explore alternative...
Curated OER
Assessing Normalcy
Students define normal distribution as it relates to the bell curve. In this statistics lesson plan, students use the central tendencies of mean, median and mode to solve problems. They plot their data and draw conclusion from the graphs.
Curated OER
What is the connection between rice and estimation?
Sixth graders investigate estimating. In this estimating lesson, 6th graders estimate how much rice is eaten around the world. Students estimate the percentages of rice eaten by other countries. Students compare rice production to other...
Curated OER
Mathematical Magazines
Students look through magazines and calculate the percentages of the types of ads in the magazines. In this percentages lesson plan, students create a graph to show their results.
Curated OER
Spot The Pattern
Students study integers. In this math lesson plan students complete several worksheets on arithmetic series, triangles and word problems.
Curated OER
Buying a Car
Students complete the PLATO ¿¿ Educational Software lesson plan: Math Problem Solving: Car Costs to determine if he/she can afford to drive the car they are planning to buy.
Curated OER
Representing Rational Numbers
Seventh graders explore rational numbers. In this fractions, decimals, and percents lesson plan, 7th graders identify and compare equivalencies between fractions, decimals, and percents. Students use hands-on activities to investigate...
Curated OER
Probability Fun
First graders use probability terminology to describe all possible outcomes of certain events. For this probability lesson, 1st graders use counters to create a pretend "purse" of objects. Students create their own probability drawings...
Curated OER
Ratios
Students identify ratios to compare quantities and understand proportions. In this math lesson plan, students work in groups and use facts from the Holocaust to calculate ratios and percentages.
Curated OER
Z-Scores
Students solve problems by identifying the percent of area under the curve. In this statistics lesson, students discuss z-scores as they calculate the different percentages under the bell curve. They calculate the standard deviation.
Curated OER
The Statistics of M&Ms
Students explore the topic of statistics with M and Ms. In this math lesson plan, students use candy pieces to sort and gather information needed to create a bar graph. This instructional activity can be adapted to accommodate students...
Curated OER
Regressive Taxes
High schoolers explain that regressive taxes can have different effects on different income groups. They see how a regressive tax takes a larger share of income from low-income groups than from high-income groups.
Curated OER
4 Month Budget Spreadsheet
Eighth graders create and maintain a spreadsheet budget based on a predetermined salary. They have an opportunity to make "investments and purchases." Budget records be kept for an imaginary 4 month period.
Curated OER
Shopping Spree
Students calculate discounts, sale price, and sale tax. In this consumer math instructional activity, students visit mock stores which have items for sale. Students calculate the final prices of items.
Curated OER
What is Soil?
Third graders examine what makes soil by creating a Venn Diagram. In this Earth environment lesson, 3rd graders identify the different components that soil is made from. Students bring soil from their homes to examine and create a Venn...
Curated OER
Ratio, Percent, & Proportions
Seventh graders explore the concept of percents, ratios, and proportions. In this percents, ratios, and proportion lesson, 7th graders have 237 ounces of beads to weigh. Students work in groups to weigh the beads in a way so that each...
Curated OER
Percents
Students explore the concept of percents. For this percents lesson, students discuss the prefix cent and words that contain that prefix. Students make bead necklaces and determine the percentages of certain beads in relation to the...
Curated OER
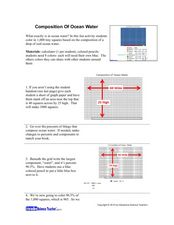
Composition of Ocean Water
Students experiment to determine the composition of ocean water. In this ocean water composition lesson plan, students color in a grid that shows the percentage of each of the components of ocean water which include chloride, sodium,...
Curated OER
How does Your Province Stack Up?
Students investigate data about age, and sex of a population. In this statistics lesson, students are given data on a population to analyze and compare to other provinces. This assignment is part of a geography lesson and requires 3...
Curated OER
Estimation With Percents
Students examine percents. In this percents lesson, students will estimate percentages. Using advertisements from a newspaper, students problem solve to determine the final price of a sale item.
Curated OER
Stock: The Rise and Fall of Stock
Students examine the uncertainties of investing in the stock market. They look at how company profits, good or bad news, and new competition affect share prices. They write and discuss journal entries about share prices before completing...
Curated OER
Egyptian Fractions
Sixth graders take a brief look at what is known about Egyptian Fractions. These are unit fractions - fractions whose numerator is one. We look at how fractions can be represented in terms of Egyptian Fractions. Finally we suggest a web...


