It's About Time
Oil and Gas Production
Would you consider a power failure a current event? This lesson uses multiple experiments, guided inquiry activities, and group discussions to cover the topics of oil and gas production. This is the seventh lesson in a series of eight.
Rainforest Alliance
Forests of Guatemala
With 90 percent of its land area covered in forests, Suriname, a country in South America, contains the largest percentage of forests throughout the world. Here is an activity that brings classmates together to learn about the...
Curated OER
The Stock Market
Students explore the loss and gain made in the stock market as they invest a sum of money and report the results as percentages instead of points.
Curated OER
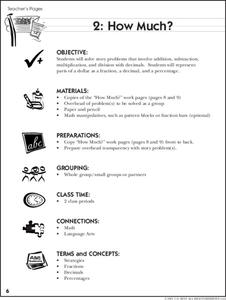
How Much?
It's time to go back over all that your class has learned about decimals, fractions, and percentages! To do so, individuals solve story problems that involve addition, subtraction, multiplication, and division with decimals, explain how...
Curated OER
Mathematics & Nutrition
Students apply math to calculate fat and calories in the food they eat. They examine food package information to become aware of the ingredients and to learn about healthy life styles. They work in groups to create crazy meals using the...
Curated OER
Scaling Up Art
Students measure a sculpture of a human and measure other students. They determine the average size of humans and create a life size image of the sculpture. They work with percentages as they create the images.
Curated OER
Graphing Our Snacks
Pupils gather information from Nutrition Facts labels on their favorite snack foods. They graph the fat content of the foods and reflect on what they see.
Curated OER
Kinzi Deaf Alumni
Young scholars use data of school alumni to create a database. The lesson uses technology and access to a computer lab is essential. The concepts of graphing statistics is also used to help teach across the curriculum.
Curated OER
A Statistical Study of the Letters of the Alphabet
Learners gather appropriate information for simple statistical analysis. Then they will calculate probability working with a piece of literature that makes this lesson ideal for teaching across the whole curriculum.
Curated OER
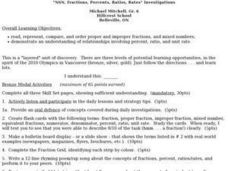
"NSN, Fractions, Percents, Ratios, Rates" Investigations
Sixth graders engage in an investigation about the concepts related to fractions. They read, represent, compare, and order proper and improper fractions, and mixed numbers. They demonstrate an understanding of relationships involving...
Curated OER
Videobusters
A real-world scenario, Videobusters, a video rental store has just got to get organized. In small groups, the class works on organizing and analyzing data utilizing matrices. They need to use their skills in adding, subtracting and...
Curated OER
Agriculture & Alaska's Economy
Students examine Alaska's agriculture numbers from previous years. They answer questions based on Alaska's production levels.
Curated OER
Fractions: Jewish Population of Europe during WWII
Students evaluate population maps and convert fractions to percentages. In this WWII lesson, students use statistics on the Holocaust to determine population loss and change. Students create their own math questions and answers using the...
Curated OER
Take A Chance Or Two
A two-part lesson immerses young statisticians in the concept of probability. On the first day, will conduct experiments with a two-colored coin and learn how to write probabilities as fractions, ratios, and percentages. In the second...
Curated OER
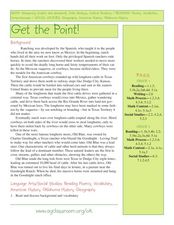
Getting The Point
Young scholars complete a unit of lessons on the relationships between decimals, whole numbers, and fractions. They use paper strips to solve fraction problems, view and solve examples, and use calculators to convert fractions into...
Curated OER
It's a Sale!
Students make good decisions about making purchases of items on sale and explain how percentages effect cost.
Curated OER
Scaling Down Art
Students change the scale of a work of art using ratios, percentages, and proportions. While this is technically an art lesson, there is quite a bit of mathematics involved in converting to the correct scale.
Curated OER
Time Management: Piece of Pie
Students examine their own lives and how well they manage their time outside of school. In this this time management lesson, students discover the amount of time they spend on other activities, and create a pie chart with that...
Curated OER
The Good, The Bad, The Ugly
Sixth graders examine the causes of the stock market crash of 1929. In this integrated math/history unit on the stock market, 6th graders study, research, and read stocks, visit a local bank, and create a PowerPoint to show the finished...
Curated OER
Fraction Conversion 2 (With Percents)
Fifth graders determine how to convert fractions, decimals, and percents. In this conversion instructional activity, 5th graders use an on-line applet to practice making these conversions. They review how to make the conversions in a...
Curated OER
Charts and Graphs
Fifth graders interpret data into graphs and percentages. In this organizing data instructional activity, 5th graders discuss bar, circle and line graphs. Students complete bar graph and apply probability using the results.
Curated OER
M&Ms; Line Plots and Graphing
Students, using small individual bags of M&Ms, engage in activities including; estimating, sorting, graphing, mean, median, mode, fractions, percentage, and averaging.
Curated OER
Data Management and Probability: Applications
In this data management and probability applications instructional activity, 7th graders solve 13 different types of problems that include finding the mean, median, mode, and range of each set of values, as well as, solving a number of...
Curated OER
Take Another Look
Seventh graders analyze different types of graphs and answer questions related to each. In this math lesson, 7th graders organize a given diagram to make it easier to interpret. They discuss why they made such changes.


