PBS
Pbs Mathline: Sand Babies (Pdf) [Pdf]
In this engaging activity, students use a variety of measurement strategies in creating their own Sand Babies. Students explore standard and non-standard measurements, area, data collection and analysis, and graphing. Adaptations are...
ClassFlow
Class Flow: Graphs
[Free Registration/Login Required] This flipchart is a quick review of line, bar, and circle graphs.
McGraw Hill
Glencoe: Using Graphs to Understand Data Quiz
This is a quiz with five quick questions to check your knowledge of how to use graphs to understand data. It is self-checking.
Varsity Tutors
Varsity Tutors: Hotmath: Practice Problems: Tables and Graphs
Six problems present various aspects of using and making tables and graphs to display statistics. They are given with each step to the solution cleverly revealed one at a time. You can work each step of the problem then click the "View...
Texas Education Agency
Texas Gateway: Selecting and Using Representations for Collected Data
[Accessible by TX Educators. Free Registration/Login Required] Given a variety of data (including line plots, line graphs, stem and leaf plots, circle graphs, bar graphs, box and whisker plots, histograms, and Venn diagrams), the student...
Illustrative Mathematics
Illustrative Mathematics: S cp.b.9: Random Walk Iii
The task provides a context of "random walking" to calculate discrete probabilities and represent them on a bar graph. Aligns with S-CP.B.9.
Rice University
Rice University: The Hand Squeeze
Students will enjoy this data collection and class analysis experiment involving the time it takes for a hand squeeze to travel around a circle of people. From organizing the activity to collecting the data to making a table and graphing...
The Math League
The Math League: Using Data and Statistics: Pie Charts
This introductory tutorial about statistical graphing with four examples of how pie charts (circle graphs) are constructed and read.
E-learning for Kids
E Learning for Kids: Math: Treasure Island: Interpreting Data
Students will play interactive games to interpret information from different types of graphs.
PBS
Pbs: Mathline Creature Feature Lesson Plan [Pdf]
An interdisciplinary math, science, and language arts lesson that engages students in an exploration of statistics. Through a study of various forest climates, students utilize data collection and analysis, classification, and graphing....
That Quiz
That Quiz
ThatQuiz is an excellent assessment tool for teachers and students. At this site, teachers can create individualized or group assessments on a variety of math topics. Students take these practice assessments directly online and receive...
Cuemath
Cuemath: Data Handling
This comprehensive guide about data handling helps with understanding how the study of data handling and graphical representation of the data along with other tools help us in dealing with numerical data. Includes solved examples and...
The World Bank
World Bank: Poulation, Total
This site from the World Bank provides data on population for most of the countries of the world in 2020, and shows the change in the rate from 1960 to 2020. Statistics are presented in a chart, line graph, bar graph, and map. The data...
The World Bank
World Bank: Mortality Rate, Infant (Per 1,000 Live Births)
This site from the World Bank provides data on infant mortality for most of the countries of the world in 2020, and shows the change in the rate from 1960 to 2020. Statistics are presented in a chart, line graph, bar graph, and map. The...
Teachnology
Teachnology: Survey Teaching Theme
Survey Theme provides an excellent collection of free sample worksheets, teacher resources, lesson plans and interactive media for grades k-12.
Teachnology
Teachnology: Survey Teaching Theme
Survey Theme provides an excellent collection of free sample worksheets, teacher resources, lesson plans and interactive media for grades k-12.
Council for Economic Education
Econ Ed Link: Who Is Working?
This lesson teaches students what economists mean when they talk about people who are employed, unemployed, and not in the labor force. It discusses the Current Population Survey and asks students to pose as government survey workers to...
Other
Stat Soft: Statistics Glossary
Dozens of statistical terms are defined and illustrated in this glossary.
The Math League
The Math League: Ratio and Proportion
This tutorial provides definitions and examples of ratios and proportions and features comparing ratios and converting rates.
Better Lesson
Better Lesson: Say It With Stats! Review
The students will be working in centers to review for their test. The centers will consist of a computer rotation, versa-tiles, and a teacher center. All centers will reinforce concepts learned throughout this unit to prepare them for...
Louisiana Department of Education
Louisiana Doe: Louisiana Believes: Eureka Math Parent Guide: Collecting and Displaying Data
A guide to support parents as they work with their students in collecting and displaying data.
Louisiana Department of Education
Louisiana Doe: Louisiana Believes: Eureka Math Parent Guide: Problem Solving With Length, Money, and Data
A guide to support parents as they work with their students with problem solving with length, money, and data.
Texas Instruments
Texas Instruments: Stretching Slinkies
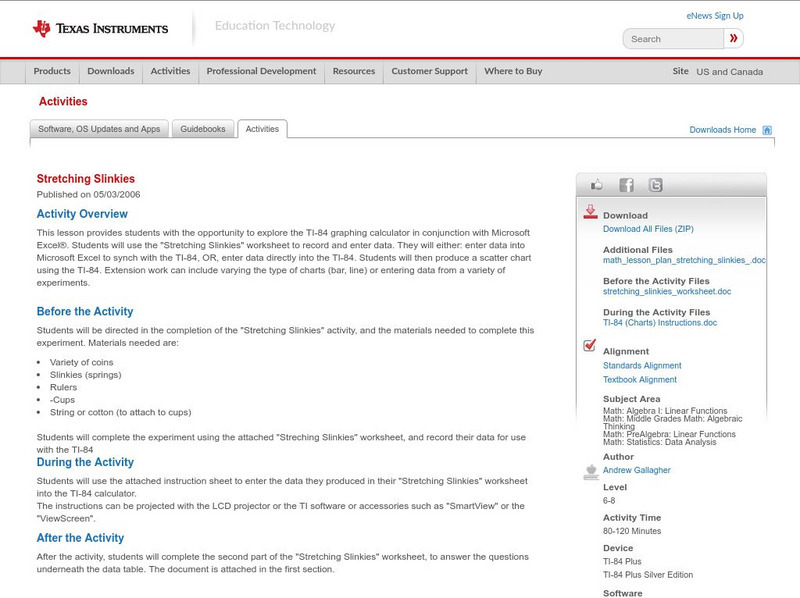
This lesson provides students with the opportunity to explore the TI-84 graphing calculator in conjunction with Microsoft Excel. Students can use the "Stretching Slinkies" worksheet to record and enter data. They will either: enter data...
Other popular searches
- Bar and Line Graphs
- Bar Graphs Line Graphs
- Bar, Line, Circle Graphs
- Bar Line Circle Graphs
- Bar Graphs and Line Graphs
- Bar Graphs, Line Graphs
- Bar Line Graphs
- Bar, Line, and Circle Graphs
- Bar & Line Graphs
- Double Bar Line Graphs


![Pbs Mathline: Sand Babies (Pdf) [Pdf] Lesson Plan Pbs Mathline: Sand Babies (Pdf) [Pdf] Lesson Plan](https://d15y2dacu3jp90.cloudfront.net/images/attachment_defaults/resource/large/FPO-knovation.png)


