Curated OER
Data Shuffle
Middle schoolers find an advertisement or newspaper using charts or graphs. They create another graph using the same information in a different format. They write a comparison of the two graphs.
Curated OER
Introduction to Graphical Representation of Data Sets in Connection to Cellular Growth
Students practice graphing relationships between variables by studying topics such as exponential growth and decay. They conduct a series of numerical experiments using a computer model and a variety of physical experiments using mold,...
Curated OER
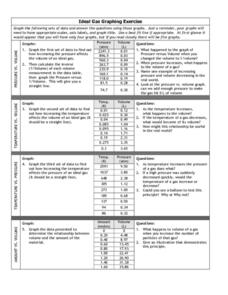
Graphing Exercise of Ideal Gas Data
For this graphing of Ideal Gas Data worksheet, students use the given data to draw 4 graphs of the given data. They are given the pressure and volume to draw and interpret the graphs.
Curated OER
Mystery Graphs
Pupils study graphs and learn how to display information into a graph. In this graph lesson plan, students construct a graph of their own sorted data, and pick out things in graphs that are inconsistent.
Curated OER
My Peanut Butter is Better Than Yours!
Students explore the concept of statistical data. In this statistical data lesson, students read an article about the dangers of peanut butter to those who are allergic. Students perform a taste test of two different brands of peanut...
Curated OER
Circles Minilab
Young scholars learn how to measure the diameter and circumference of a circle. For this circle lesson, students organize their data to create a graph. Young scholars utilize their graph to make an inference about the slope of pi.
Curated OER
Student Heights
Students measure the heights of their fellow classmates and create a box and whisker plot to display the data. In this measurement lesson plan, students analyze the data and record results.
Curated OER
Stemmin'-n-Leafin'
Learners make stem and leaf charts to determine the measures of central tendency using test score data. They analyze the data to draw inferences which they share with the class. They complete the associated worksheets.
Curated OER
Life Expectancy at Birth
Students create a line graph on the life expectancy for males and females in Canada. In this math and health lesson plan, students review table and graph terminology, create line graphs, and analyze the differences in life expectancy...
Curated OER
Hot, Wet, and Cold
Pupils research climate data for a city in each of the 5 major geographic sections of Texas. They use data to describe the climate and what influence the geography of that section has on the weather.
Curated OER
Lahar Travel Time
Ninth graders analyze published geologic hazard maps of California and comprehend how to use the map's information to identify evidence of geologic events of the past and present and predict geologic changes in the future. They select...
Curated OER
Walking on Air
Pupils collect and analyze data with a graph. In this statistics instructional activity, students use central tendencies to find the meaning of their data. They display the data on a Ti calculator.
Curated OER
Local Traffic Survey
Young scholars conduct a traffic survey and interpret their data and use graphs and charts to display their results.
Curated OER
ou are the Researcher!
Students conduct a census at school. They collect data, tally it, and create a frequency table. Students display their data in three different types of graphs. They write complete sentences describing the graph.
Curated OER
Growing Plants
Students grow plants and track their growth over time. For this growing plants lesson, students plant seedlings and chart their growth in a data analysis activity.
Curated OER
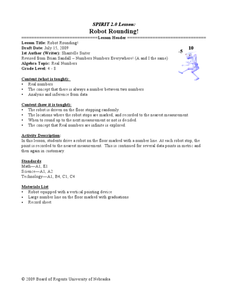
Robot Rounding!
Students collect data on a robot and relate the behavior to prove there is an infinite minute set of numbers. In this algebra lesson, students verify that there is always a number between two numbers. They analyze and make inference from...
Curated OER
Discovering Pi
Students develop a formula that describes the functional relationship of the circumference of a circle to its diameter. Working with a partner, they measure the diameter and circumference of circular objects in order to discover the...
Curated OER
Hurricanes and Climate
Students investigate maps and data to learn about the connections between hurricanes and climate. In this exploratory lesson students describe and graph the 6 regions where hurricanes happen and discuss how hurricanes have changed over...
Curated OER
Family Size
In this family size activity, students complete a tally chart to determine data from a family size line plot. They organize the data in the chart to determine the mean, median, mode, and range of the data. There are six problems in...
Curated OER
Functions As Graphs Worksheet
In this math worksheet, young scholars graph the data given in the organizer. The functions are used to create the new line for finding the possible unknowns.
Curated OER
Integrated Algebra Practice: Frequency Histograms, Bar Graphs and Tables
In this graphs worksheet, students solve 4 problems about histograms, bar graphs, and tables. Students answer questions about histograms, bar graphs, and tables.
Curated OER
Lesson 6-7: Scatter Plots and Equations of Lines
For this scatter plot worksheet, students examine tables and write a linear equation that matches the table. Students graph linear equations. They read scatter plots, determine the trend line, and write a linear equation to match...
Curated OER
Graphing With Candy
Students gather information and interpret the results using a tally chart, a table, and a bar graph.
Curated OER
Creek Detectives WISE On-line Research Community
Students investigate ways people cause harm to the environment. In this environmental lesson, students explore a case study on the Internet. Students explore all of the online activities and collect data for a presentation.


