Curated OER
Weather... Or Not
Students observe and discuss the local weather patterns, researching cloud types and weather patterns for cities on the same latitude on the Internet. They record the data for 6-8 weeks on a graph, and make weather predictions for their...
Curated OER
Tracking Speed
Students collect data for a runner by measuring the time it takes for the runner to run equal distances. After collecting data, students average speeds and accelerations for the runner. Assignment is completed by graphing the data.
Virginia Department of Education
How Much is that Tune?
Tune in for savings! Scholars investigate pricing schemes for two different online music download sites. After comparing the two, they determine the numbers of songs for which each site would be cheaper.
Curated OER
Best Guesser
Fifth graders develop strategies for estimating ages, and illustrate results by graphing and interpreting scatter plots to compare x and y coordinates.
Curated OER
Modeling Population Growth
Learners investigate the reasons for taking a census and determine the problems that are involved in the process. They examine the population figure for Montana and Lake county before using the information to complete the included...
Curated OER
Microsoft Excel Lesson Plan
Fifth graders collect, organize, interpret data. In addition, they compare different textures, color including graphical representations such as bar graph, line graph .Students also describe the uses of rocks and how to use that to...
Curated OER
Dirty Water
Students, through a case study of actual water sources in Washington State, identify major sources of aquatic pollution. They also categorize pollutants, make inferences about the effects of pollutants on the environment and construct...
Curated OER
Slopes and Linear Equations
Young scholars find the slopes of linear functions. In this graphing instructional activity, students analyze linear equations and calculate the slope of the line. They graph a line given the slope and y-intercept.
Alabama Learning Exchange
Investigating School Safety and Slope
Learners investigate the slope of various stairways through a "news report" approach and employ mathematical knowledge of applied slope to report on wheelchair accessibility and adherence to Americans with Disabilities Act. They...
Curated OER
What's The Point?
Students solve word problems using the correct math symbols. In this algebra lesson, students use the TI calculator to graph their equation and analyze it. They find the line of regression and use to draw conclusion.
Curated OER
Equivalent Algebraic Equations
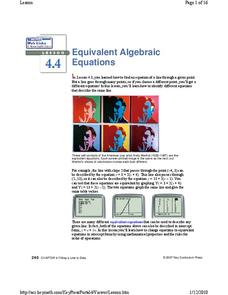
Ninth graders explore linear equations. For this Algebra I lesson, 9th graders investigate how different equivalent equations can be used to describe any given line. Students explore how to change equations to equivalents equations by...
Curated OER
A Comparison of Land and Water Temperature
Students examine NASA satellite observations of surface temperature and investigate the seasonal changes of land and water temperature.
Curated OER
Linking Algebra to Temperature
Students convert between two units as they calculate the temperature. In this algebra lesson, students collect data on seasonal climate and create a graph. They make conjectures based on their data collection.
Curated OER
How Far Will It Roll?
Learners construct a car with the longest roll using a ramp. They construct Lego cars, modify the wheel sizes and car configurations to evaluate which car design rolls the longest distance, develop a graph, and complete a worksheet.
Curated OER
Car Maze competition
Young scholars use graphs to calibrate an RCX car. They must then program the car to traverse a maze using their calibrations
Curated OER
Race The Rapper: Slopes
Students calculate the slope of the equation In this algebra lesson, students graph coordinate pairs of linear equations and identify the relationship between x and y values and slope. They differentiate between functions and relations....
Curated OER
Relating Distance and Velocity Over Time
Students calculate the distance and velocity over time. In this algebra lesson, students graph a linear function to represent the distance vers time travel. They interpret their graphs and draw conclusion.
Curated OER
Choosing a Summer Job
What did you do over your summer vacation. Young wage earners must compare summer job options, and determine when each job earn the same amount and what that amount be. This be done by creating, graphing, and solving systems of...
Curated OER
Standard Linear Form
Ninth graders identify and describe the x-intercept as the place where the line crosses the x-axis as it applies to football. They create their own differentiations to reinforce the distinction between the x-intercept and the...
Curated OER
School-Wide Recycling
Students investigate recycling. In this environmental lesson, students design a recycling program for their school. Students collect data about how much recyclable materials they use in one week. Students also survey classmates about how...
Curated OER
Linear Equations and Cell Phone Plans
Students calculate the amount of minutes they get charged for each month. In this algebra lesson plan, students relate linear equations to talking on the phone and the cost to do so. They create graph to plot the cost and usage of the...
Curated OER
Correlate This!
Learners investigate different correlations. For this algebra lesson, students analyze graphs and identify the lines as having positive, negative or no correlation. They calculate the line of best fit using a scatter plot.
Curated OER
Slip Slide'n Away
Students analyze the sliding of boxes along a warehouse floor. In this algebra lesson, students connect math and physics by calculating the friction created by the sliding of each box. They develop faster method to move the box, based on...
Curated OER
Polynomial Functions
Learners explore polynomial functions. In this Algebra II lesson plan, students explore graphs of polynomial functions as classify the functions as linear, quadratic, cubic, or quartic. Learners determine the regression equation for...


