Curated OER
Jelly Belly: What a Wonderful "Bean"!
Students explore how jelly beans are produced. They discuss the origins of the jelly bean and view a video about how jelly beans are prepared, tested, shaped, finished, and shipped and estimate the amount of jelly beans in a jar and sort...
Curated OER
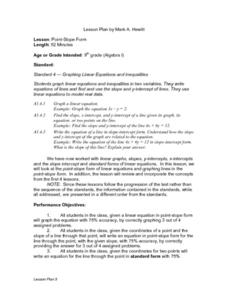
Point-Slope Form
Ninth graders explore the point-slope form of linear equations and graph lines in the point-slope form. After completing the point-slope equation, they identify the slope of a line through a particular point. Students explain the...
Curated OER
Leap Frog Experiment
Second graders ask questions and design an experiment to explore different spinners in "The Leap Frog" board game. They conduct their experiment, collect information and interpret the results using a graph.
Curated OER
A Bar of Many Colors
Second graders use colored candies to collect data, construct double bar graphs, and find averages.
Curated OER
Linear Functions
Students solve and graph linear equations. In this algebra instructional activity, students collect data and plot it to create a linear function. They identify the domain and range of each line.
Curated OER
Mathematical Models with Applications: The Sounds of Music
Pupils use an electronic data-collection device to model the sound produced by a guitar string. They identify the graph of a periodic situation and use the graph to determine the period and frequency of sound waves.
Curated OER
Describing the Motion of a Battery Powered Cars
Students explore distance a toy car travels by changing the amount of batteries used to power the toy car. In this force and motion lesson plan, students calculate the average speed of a car while investigating the power from various...
Curated OER
Slopey Math
Students identify the slope of a line and use it to solve real life problems. In this algebra activity, students write linear equations in slope intercept form and make a correlation to its relation to the real world. They use the slope...
Curated OER
Surface Meteorological Observation System (SMOS)
Learners investigate local surface weather conditions. They log weather conditions for thirty days, develop a graph, plot cloud cover, and compare/contrast the graphed lines of various weather factors.
Curated OER
Weather: Like It or Not!
Second graders investigate daily weather changes. In this earth science lesson, 2nd graders identify the different terms used to describe weather. They use the outdoor thermometer to record data.
Utah LessonPlans
Seed Sort
Students form a variety of categories for seed mixes (wild bird seed or 15 bean soup) and create graphs to display their categories.
Curated OER
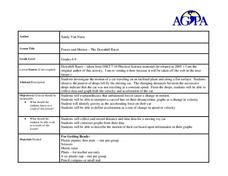
Forces and Motion-The Downhill Racer
Students calculate a toy car's velocity and acceleration. In this force and motion instructional activity, students build ramps and attach a dropper to a toy car, which is released down the ramp. Students calculate and graph velocity and...
Curated OER
It's a Drag!
Students create number lines using decimals and whole numbers. In this algebra lesson, students graph and solve linear equations. They plot ordered pairs on a coordinate plane correctly.
Curated OER
Hot Stuff
Students investigate if heat can change the form of matter. In this physics lesson plan, students use heat sources to observe the changes in an ice cube. Students graph which heat source changed the matter the fastest.
Curated OER
Electromagnets: Winding Things Up!
Students explore solenoids and electromagnets. After building an electromagnet, students use a TI Graphing calculator, a CBL 2 interface and a magnetic field sensor to measure the strength of a magnetic field. They create a graph of...
Curated OER
Friction of a Block Weight
Fifth graders hypothesize and design an experiment to study the relationship between a block weight and the number of washers it takes to pull a block across various surfaces. Students graph results and apply their findings to a...
Curated OER
Specific Heat and Insulation
Students measure the air and soil temperatures at designated times. They graph the temperatures of each on one piece of graph paper with different colors. Students compare the information for the two line plots and analyze their results...
Curated OER
Earth Matters
Students identify Earth's equator, prime meridian, lines of latitude, lines of longitude, parallels, and meridians.
Curated OER
Integrated Social Studies and Math Lesson
Fourth graders study the American Civil War. They read and analyze information regarding the casualties of the Civil War, fucusing on Indiana soldiers. They graph the information and then write in their reflective journals responding...
Curated OER
The Doctrine of Signatures
Students use the graphing calculator and the core equation: y=Ax^2+Bx+C where A = the acceleration of gravity/2, B = the initial velocity, and C = initial height above ground to graph parabolas for Earth and Mars. They experiment with...
Curated OER
Using A Volunteer Acquired Database Constructed On The Internet, Examine the Relationship between Dissolved Oxygen and Water Temperature
Ninth graders access a database and open a spreadsheet. In this oxygen and water temperature lesson students save the database, sort it and generate scatter plot graphs.
Curated OER
Compound Inequalities
Pupils solve problems with compound inequalities. In this algebra instructional activity, students solve inequalities using addition, subtraction, multiplication and division. They graph-their solutions on a numbers line.
Curated OER
How Does a Spring Scale Work?
Students create visuals of the effect of a spring scale. In this algebra lesson plan, students use the navigator to graph the effects created by a spring scale. They draw conclusion from the graph.


