Curated OER
Graphing Linear Equations
Students graph linear equations. In this algebra lesson, students investigate the price of tolls in different states and create a graph. They analyze their graph and draw conclusions.
Curated OER
Problem-Solving Application: Use a Graph
In this problem solving worksheet, 6th graders use the problem solving steps of understand, plan, solve and look back to answer a graphing question.
Curated OER
Carnival Tickets-Graphing
In this graphing activity, students first make a line plot with given information about tickets earned for a school carnival, then answer 3 related questions.
Curated OER
Which Car Should I Buy?
Students use gas mileage of different cars to create T charts, algebraic equations, and graphs to show which gets better mileage. In this gas mileage lesson plan, students use the graph to see which car they should buy.
Curated OER
Hit and Run
Pupils explore data collection in this lesson. They investigate distance vs. time and velocity vs. time graphs using information collected with a CBR 2 to simulate the reconstruction of an accident.
Curated OER
Mine Shaft Grade 8 Slope
Eighth graders investigate slopes using real life scenario. In this algebra lesson plan, 8th graders model and interpret real life data. They plot their data in a coordinate plane and discuss the results with the class.
Curated OER
Parachutes: What a Drag
Sixth graders make 2 different kinds of parachutes and record and graph the time for each one for the different drag forces. In this parachute lesson plan, 6th graders compare the results to the rest of the class of each parachute and...
Curated OER
Approximation of Pi
Students explore the concept of Pi. For this Pi lesson, students measure the circumference and diameter of a circle. Students record the diameter and circumference measurements from their classmates. Students enter the data into lists...
Curated OER
Thermometric Titration
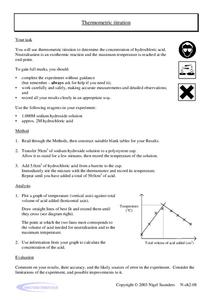
In this thermometric titration worksheet, students titrate hydrochloric acid with sodium hydroxide to determine the concentration of hydrochloric acid. They measure the change in temperature of the solution, plot their data and use the...
Curated OER
How Do Astronomers Measure Distances to Stars?
In this astronomy instructional activity, students participate in an activity using the parallax effect to measure star distances. They record their information in a data table then complete 5 fill in the blank conclusion questions.
Curated OER
The Apple Orchard Problem
Students explore various approaches to solving a problem of maximizing the total production of apples in an orchard. In this apple orchard lesson, students collect data in order to solve the apple orchard problem presented. Students plot...
Curated OER
Let's Gather Around the Circle
Scholars explore the relationship between circumference and diameter. Groups of learners measure the diameter and circumference of round objects and record their data on a given worksheet. They then input the data into their graphing...
Curated OER
Carbon Dioxide Increases
In this atmospheric carbon dioxide instructional activity, learners use a graph of the Keeling Curve showing the increase in atmospheric carbon dioxide since 1958 to solve 6 problems. They determine the rate of increase, the find the...
Curated OER
Betweenness and the Sum of Parts
High schoolers differentiate lines and angles using betweenness in this geometry lesson. They differentiate angles and lines using Cabri Jr. and analyze the data and make conjecture.
Curated OER
Boyle's Law Lab
In this gas lab, students use a pressurized soda bottle with a closed end syringe to simulate Boyle's Law. They alter the volume and watch the effects on the pressure of the gas. They plot their data and answer eight post lab questions.
Curated OER
Areas Under Curves: An Astronomical Perspective
In this area under the curve learning exercise, students use a graph of the number of exoplanets discovered and the year they were discovered to solve 5 problems. Students find the total area under the curve, they find the total number...
Curated OER
Walking the Plank
Eighth graders experiment with a bathroom scale, books and a plank to determine how weight readings change as distance is applied. They graph and interpret the results.
Curated OER
The Graduation Dilemma
Ninth graders explore data analysis. In this Algebra I lesson, 9th graders collect and organize data to create a scatter plot. Students use the regression feature of the calculator to find the line of best fit and use the equation to...
Curated OER
Make a Graph
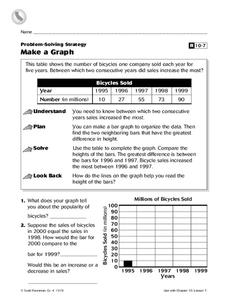
In this graphs worksheet, 4th graders, after studying and analyzing a table on bicycles sold within several years, answer 2 short answer questions relating to the table.
Curated OER
Water: From Neglect to Respect
The goal of this collection of lessons is to make middle schoolers more aware of the ways in which they are dependent upon water to maintain their standard of living. Learners compare water use in Lesotho to water use in the United...
Curated OER
Radioactive Simulations
Students simulate radioactive decay and nuclear power using an on line interactive web site. In this on line lesson plan, students monitor radioactive isotopes and record the activity of a particular element as the decay progresses. They...
Curated OER
Spaghetti Bridges: Student Worksheet
Here is a wonderful activity that allows young engineers to try their hand at designing a bridge out of spaghetti! The learning exercise explains the activity and also provides a graph for keeping track of the results. Very good!
Center Science Education
Hurricanes and Climate
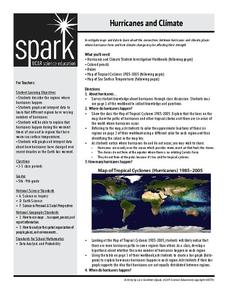
Feeling under the weather? This lesson on hurricanes can whip things up! With professionally designed maps and handouts, teach your future weathermen (or women) where, when, and how hurricanes occur. They identify hurricane regions and...
Wake Forest University
Authentic Activities for Connecting Mathematics to the Real World
Check out the handout from a presentation that contains a collection of high school algebra projects connecting a variety of mathematics to the real world. Activities range from simple probabilities to calculus. The activities can be...


