Curated OER
What Can You Learn From A Mealworm?
Students collect data from mealworms. For this science and math lesson plan, students gain an understanding of collecting metric data using mealworms.
Curated OER
Understanding Equations of Functions
Students write equations for different functions. In this algebra lesson plan, students observe data and find the function that goes along with that data. The identify the line of best fit.
Curated OER
What Happened to the Mean and Median
Learners find the mean, median and mode. In hs statistics lesson, students collect, plot and analyze data. The identify the effect the central tendency have on the data and line.
Curated OER
The Greenhouse Effect
Seventh graders investigate the temperature change in open and closed containers. In this earth science instructional activity, 7th graders relate this lab activity to greenhouse effect. They create a line graph from data collected in...
Curated OER
Leaping Lemurs! How far can you jump?
Students watch a segment of the PBS video which show the lemurs' ability to jump. In pairs, students collect measurement data involving each other's length of a standard step, a standing broad jump, and a long jump. They record their...
Curated OER
Population Pyramids
Students create a population pyramid based on current data for their final project country. They analyze data from comprehension trends of final project country. Students analyze populations of specific countries.
Curated OER
Family Vacation
Students use math to plan a trip by houseboat down the Mississippi River. They research and obtain information on the Mississippi River and its surroundings and use multiple graphs to represent their data.
Curated OER
The Origins and Maintenance of Earth's Atmosphere
For this atmosphere worksheet, students read over a data table showing the percentage of carbon dioxide, oxygen and nitrogen in the atmosphere over the last 4500 million years. Students create a graph comparing these gases over time and...
Curated OER
Modeling Population Growth
Learners collect data on population growth. In this statistics lesson, students graph their data and make predictions. They find the linear regression and the best fit line.
Curated OER
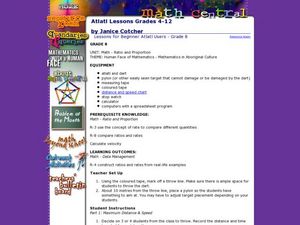
Atlatl Lessons Grade 4-12
Students experiment with velocity, ratios, and rates. In this data management lesson, students throw a dart with and without using an atlatl and collect and record various data. Students construct ratios based on the data and determine...
Curated OER
Comparison of Two Different Gender Sports Teams - Part 1 of 3 Measures of Central Tendency
Students gather and analyze data from sports teams. In this measures of central tendency lesson, students gather information from websites about sports team performance. Students analyze and draw conclusions from this data. This lesson...
Curated OER
Skittles Lab
Students use Skittles as manipulatives to practice computing decimals from fractions, computing decimals into percentages, and creating bar graphs from gathered data.
Curated OER
Changing Rocks
Young scholars shake a box containing Plaster of Paris "rocks", gravel, and sand, to measure the effects of erosion. They work individually during this exercise. This task assesses students' abilities to make simple observations,...
Curated OER
Getting to Know the Thirteen Colonies
Fifth graders analyze information about the thirteen colonies. Using the information, they can manipulate and identify a region in which the colony is located. As a class, they make generalizations about the various regions and time...
Curated OER
Writing Linear Equations in Different Forms
Can your class write linear equations three different ways? Here is a study guide that includes slope-intercept, standard, and point-slope forms. Learners are given the slope and a point on the line, or two points and are asked to write...
Curated OER
Sizing Pumpkins
Fifth graders study the sizes of pumpkins. They measure and record the diameters of pumpkins. They create five subtraction problems and solve them. They weigh their pumpkins, record the data and select two pumpkins to make a graph of...
Curated OER
Human Populations Studies: the Ghost of Populations Past
Students compile data on population distribution and develop survivorship curves using information from cemetery tombstones and obituaries. They develop inferences on the changes in population age distribution in their area over time.
Curated OER
Amazing Bean Races
Students experiment with bean growth in varied conditions. In this plant biology lesson, students plant beans in soil and in spun cellulose (absorbent material in diapers) and measure the growth of their seedlings. They collect the data...
Noyce Foundation
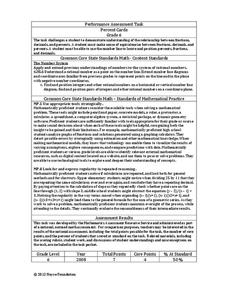
Percent Cards
Explore different representations of numbers. Scholars convert between fractions, decimals, and percents, and then use these conversions to plot the values on a horizontal number line.
Curated OER
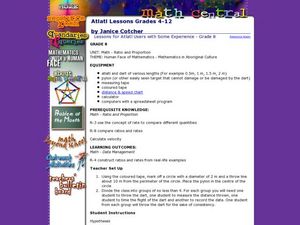
Atlatl Lessons for Grade 8
Eighth graders explore the weapons of the Aboriginal people. In this eight grade math/science lesson, 8th graders collect and analyze data regarding the speed and distance of a dart thrown with an atlatl. Students choose the...
Yummy Math
Deflate-gate
Does temperature affect the air pressure of a football? Young mathematicians look at the readings from a pressure gauge and determine if the balls are within regulation or are under inflated.
Curated OER
More Students Taking Online Courses
In this graph learning exercise, students study a bar graph that shows the number of college students taking at least one online course. Students answer 4 problem solving questions about the data on the graph.
Curated OER
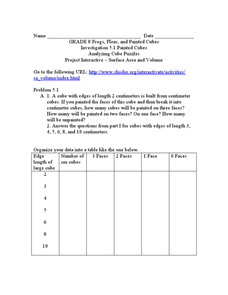
Analyzing Cubes
In this analyzing cubes worksheet, 9th graders solve and complete 6 different types of problems. First, they organize the given data into the table provided. Then, students study the patterns in the table and tell whether the pattern of...
Curated OER
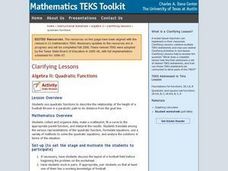
Algebra II: Quadratic Functions
Students collect and organize data, make a scatterplot, fit a curve to the appropriate parent function, and interpret the results. Students translate among the various representations of the quadratic function, formulate equations, use a...


