Curated OER
The Closer I Get To You
Pupils explore the law of reflection. Through experimentation and problem solving, they collect and analyze data pertaining to reflection. The data is plotted on a graph and formulas for calculating the x and y values are evaluated.
Curated OER
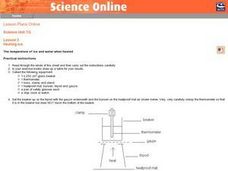
Heating Ice: The temperature of ice and water when heated
Seventh graders read and follow the instructions on the worksheet. They make a table of their results. Students use about 100 cm^3 of water and ice mixture. They heat the water/ice with a Bunsen burner. Temperature is recorded every 30...
Curated OER
Heating of Water: Water Vapour
Seventh graders read the directions printed on their worksheet and follow them carefully. They set up a beaker with a tripod and Bunsen burner under it. They record the temperature of water every 30 seconds. Students graph the data and...
Curated OER
Lab Sheet: Exponential Growth and Decay
In this exponential worksheet, students gather information from an experiment and plot the data in a scatter plot. Using given formulas, they plot an equation of a line and then compare the graphs. Students observe exponential growth...
Curated OER
Soggy Seeds
Students conduct experiments to learn about seed germination. In this seed germination lesson, students write a hypothesis for the seed experiment. students complete the experiment for seed germination and graph the data obtained from...
Curated OER
Weather
Students participate in a variety of mini-lessons including experiments, literature readings, physical education components, music, data gathering and recording and more to expose them to several themes of weather; i.e. water cycle,...
Curated OER
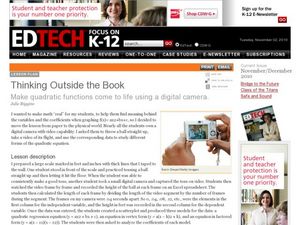
Thinking Outside the Box
Now this lesson sounds fun! Learners throw a ball, film it as it soars through the air, and use a spreadsheet to collect data. A scatterplot is created to produce a quadratic regression equation, an equation in vertex form, and an...
Curated OER
Color Enhanced Maps
Learners download or create maps with numerical weather data. They add isolines and color to create regions on their maps. They explore the visual properties of color palettes and create a visualization applying their knowledge.
Curated OER
Eyewitnesses to Change
Students explore recent changes in the Artic's climate that have been observed by Artic residents. They watch videos, take notes and create a concept map. They also look at historical weather data from a specific Artic community. The...
Curated OER
Heat Loss
Students comprehend how heat loss is affected by exposed surface area. They decide what type of and how many data to
collect. Students decide how the results should be presented. They make a series of accurate observations
Curated OER
Modelling Periodic Phenomena
In this Pre-calculus/Trigonometry worksheet, students determine the trigonometric function that best models the given data. The eight page worksheet contains explanation, examples, and twenty-one problems. Answers are not included.
Illustrative Mathematics
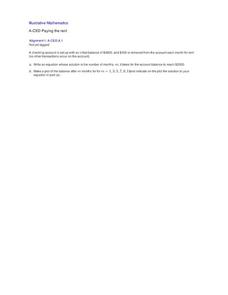
Paying the Rent
Learning how a bank account works is a useful tool. The exercise in the resource is to deduct rent from a checking account and create an equation from a description. Participants then graph the balance of the bank account versus months...
Curated OER
Factors That Affect Climate
Fifth graders use captured portions of the Internet ("mininets") to perform research into climate. They create graphs of the data recorded using latitude as the independent variable and temperature as the dependent variable.
Curated OER
Probability Distributions
Students collect and plot data on a graph. In this statistics lesson, students analyze the distribution of a sample and predict the outcome. They find the line of best fit and discuss what would make the sample larger.
Curated OER
Cool Times with Heat
Learners work with thermometers to complete problems about temperature. They investigate cooling patterns, how location affects temperature, and what happens when water having different temperature is mixed. They measure temperature in...
Virginia Department of Education
A-Mazing Plants
Have your young scientists questioned why plants grow a particular way? Through this learning opportunity, scientists gain firsthand knowledge about how plants develop and various factors that affect rates of growth as they bring plants...
Curated OER
Buy Low, Sell High
Students investigate the stock market and investing in corporate stocks by creating an investment portfolio. They develop database worksheets that track their stock's performance over a specified period of time. Students use their...
Computer Science Unplugged
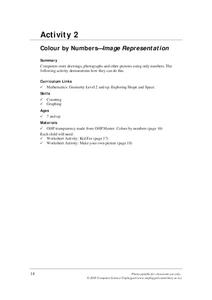
Colour by Numbers–Image Representation
How do computers store and send images? Here's an activity that explains one way a computer can compress image information. Pupils decode run-length coding to produce a black and white image. Pairs then work together to code and decode...
Baylor College
Needs of Plants
What better way to learn about plant life than by creating a class garden? Young botanists start with a brief discussion about radishes before planting seeds and watching them grow. To determine the importance of water, sunlight, and...
Wild BC
Bearly Any Ice
After reviewing food chains, your class members participate in an arctic predator-prey game that exemplifies the impact of climate change of food availability. If you are in a hurry, skip this lesson, but if you have the time to...
Federal Reserve Bank
Would Increasing the Minimum Wage Reduce Poverty?
Here is a fantastic and relevant question to discuss with your class members. Using detailed reading material and a related worksheet, your learners will learn about labor markets, equilibrium wages, price floors, and who exactly would...
AIMS Education Foundation
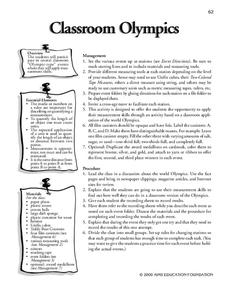
Classroom Olympics
As the Summer Olympics are approaching, incorporate Olympic-type games into the classroom. From straw javelin to cotton ball shot put, these games are sure to keep leaners engaged. The best part is that there is math involved! Pupils...
Curated OER
M&M Exponential Activity
Students create a scatter plot of their experimental data. In this algebra lesson, students use M&M's to determine an algebraic model. They discuss results in class.
Curated OER
Statistical Accuracy and Reliability
Ninth graders assess the accuracy and reliability of current survey data and how it is represented. They design a survey, collect data, and use technology to analyze the data and present the results. Students examine scatter plots and...


