Curated OER
Opening the Case
Students participate in a class survey and then design an experiment and use graphs and statistics to assist them in solving a problem. They organize the results of the survey in a stem-and-leaf plot and find the range, median, mean, and...
Curated OER
Sunrise and Sunset - Graph of Daily Solar Radiation
Students use a graph of daily solar radiation to determine the times of sunrise and sunset. They also compare how sunrise, sunset, and the length of the day changes with latitude and longitude.
Curated OER
Let's Plot Points
Use coordinate grid paper to plot points and identify shapes that are already plotted on the paper by saying their coordinates. Pupils also measure the distance between points and play the game Battleship. There are several web links and...
Curated OER
Let's Graph It!
Students graph the height of others in centimeters and inches, find the slope of line in order to calculate the conversion factor between centimeters and inches.
Curated OER
Graphing
Fifth graders create graphs based on climate in South Carolina. They read and interpret information in a chart and construct a graphy from the information in the chart. They create a spreadsheet using Excel and publish 2 graphs.
Curated OER
Graphs and Functions
Students are introduced to plotting functions on the Cartesian coordinate plane seen several categories of functions, including lines and parabolas
Curated OER
Noise Levels, Bar Graphing, and Fractions
Students research items that can damage hearing. They explore statistics about the decibels of certain objects. From the information collected, students create a bar graph. They formulate ratios to determine what sounds are harmful to...
Curated OER
Lift Equation Problem Set
Pupils, after reading an explanation from a NASA Web-based textbook, demonstrate an understanding of the text by using it, along with FoilSim, to complete an activity to graph and interpret the lift equation.
Curated OER
Chew on This
Eighth graders explore and demonstrate the seven steps of the scientific method. They predict how much sugar is in chewing gum and test, analyze, and calculate the sugar content of gum.
Curated OER
Tallies Tell It All
Students explore data collection through the use of tally marks. After a demonstration of the use of tally marks students complete various inquires where they create a chart documenting the number of times a desired result happens. They...
Curated OER
Ready for Roots
Fourth graders sort seeds and predict what conditions are needed for them to germinate. They keep the seeds moist, observe and measure their growth and graph the results. As the seeds start to grow students compare and contrast the each...
Curated OER
Pendulums
First-time physicists experiment with pendulums in this physics lesson. They vary the weight of the bob, record how long each takes to complete ten period swings, and then calculate the time for one period. They repeat the procedure,...
Curated OER
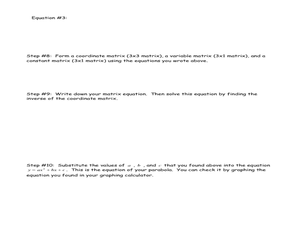
Quadratic Equations and Parabolas
Learners graph and solve quadratic equations. In this functions lesson plan, students analyze a quadratic equation using three points on a curve to define the graph of a quadratic function. They find the vertex and intercepts of the graph.
Curated OER
Wrapping It All Up
Through learning how to examine linear, quadratic, and exponential functions, students explore the effects of changes in parameters on the graphs of linear, quadratic, and exponential functions. The lesson is designed to be a review of...
Curated OER
Comparing Value for Money: Baseball Jerseys
Learners step up to the plate as they first complete an assessment task using linear equations to determine the best company from which to buy baseball jerseys. They then evaluate provided sample responses identifying strengths and...
Curated OER
Math Can Be Mean!
Fifth graders are introduced to the topic of means. Calculating the mean, mode and median, they describe what each set of numbers tell and do not tell about the data. They use a line graph to practice finding the mean. They also use...
Curated OER
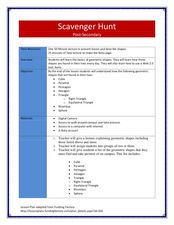
Scavenger Hunt
Young scholars collect data about lighting conditions around a room using a light sensor and RCX. They use software to upload and analyze the data in order to draw conclusions about light intensity in the room.
Curated OER
Put Your Heart Into It
First graders sort Valentine candies according to kind. Data is inserted into a spreadsheet and displayed in various graphic formats.
Curated OER
Mathematical Models with Applications: What's Your Rate of Change?
Students use regression methods available through technology to select the most appropriate model to describe collected data and use the model to interpret information. They use numeric techniques to write the equation of a line that...
Curated OER
What Does Average Look Like?
Fifth graders, in groups, study the concepts of range, median, mode, and mean through the use of graphs drawn from models. They use manipulatives to represent data that they have collected within groups.
Curated OER
You Gotta Have Heart
Ninth graders investigate the concept of relations and interpret graphs and tables. They analyze given data and look for a pattern to determine if the numbers represent a function. Students practice solving scientific word problems that...
Curated OER
Probability: the Study of Chance
Students experiment to determine if a game is fair, collect data, interpret data, display data, and state and apply the rule for probability. Students use a simple game for this experiment.
Curated OER
Natural Selection Simulation
Students simulate the changes in a natural population of birds or other species. They establish baseline data of population fluctuation for a closed population with a stable food supply. They graph the data to complete their mutations.
Curated OER
Mother May I?
Third graders measure distance using nonstandard units of measure. In this measurement lesson, 3rd graders measure a given distance through the use of the game "Mother May I?" Student gather and compare data on how many "giant steps" and...


