Curated OER
Probability: the Study of Chance
Students experiment to determine if a game is fair, collect data, interpret data, display data, and state and apply the rule for probability. Students use a simple game for this experiment.
Curated OER
Natural Selection Simulation
Students simulate the changes in a natural population of birds or other species. They establish baseline data of population fluctuation for a closed population with a stable food supply. They graph the data to complete their mutations.
Curated OER
Mother May I?
Third graders measure distance using nonstandard units of measure. In this measurement lesson, 3rd graders measure a given distance through the use of the game "Mother May I?" Student gather and compare data on how many "giant steps" and...
Curated OER
Thank You... Thomas Edison!
Pupils investigate the life of Thomas Edison. They research how he made a difference. They understand that accurate data collection is important for math. They create a chart using spreadsheet data.
Curated OER
Scientific Inquiry: Periodic Motion
Students construct their own pendulum. In this physics activity, students design an experiment to find the factors affecting its period. They formulate a conclusion based on experimental data.
Curated OER
Streamflow
Learners discuss the topic of streamflow and how it occurs. They take measurements and analyze them. They interpret data and create their own charts and graphs.
Curated OER
Self Portrait, What Nerve!
Students conduct an experiment to determine the distance between touch receptor fields in parts of the right-hand side of the body. They enter data into the data table.
Curated OER
Jack and the Beanstalk Math
Students listen to Jack and the Beanstalk and determine what they think are the most common words. In this Jack and the Beanstalk lesson, students reread the story, count the words they chosen and graph those words. Students graph the...
Curated OER
Measuring Rainfall and Relationships Between pH, Alkalinity and Suspended Solids in the Pago River
Eleventh graders test the pH and alkalinity of Pago River. In this ecology lesson plan, 11th graders collect data and use spreadsheet to graph results. They analyze and share their findings with the class.
Curated OER
The Effects of Light Intensity and Wavelength on the Rate of Photosynthesis
Students use an on line website to simulate the effects of light intensity and wavelength on photosynthesis. In this photosynthesis lesson plan, students determine how wavelength of light and intensity of light affect the rate at which...
Curated OER
Relations and Functions
Students differentiate between a relation and a function. In this algebra lesson plan, students identify a pair of coordinates as being a relation or a function. They analyze graphs for function as they solve word problems.
Curated OER
More Rocket Science
Young scholars observe two rocket science experiments, and create a graph to demonstrate the results. They draw a picture and write an explanation of the results of the experiments.
Curated OER
Equations Lesson Plan
Seventh graders play "What's my Rule" beginning with simple equations and working towards harder problems as student's gain confidence. They evaluate the equations by graphing them. Students identify the slope and y intercepts of the...
Curated OER
Black History Project
Third graders explore and analyze about famous African-Americans by listening to four picture book biographies. They generate a list of 15 famous African-Americans and then create a survey to rank them according to importance of...
Curated OER
Equivalent Fractions Manipulatives
Students study fractions. In this equivalent fractions lesson, students utilize fraction strips to enhance their understanding of equivalent fractions. They watch a demonstration and then work independently with their own set of fraction...
Noyce Foundation
Sewing
Sew up your unit on operations with decimals using this assessment task. Young mathematicians use given rules to determine the amount of fabric they need to sew a pair of pants. They must also fill in a partially complete bill for...
Curated OER
Best Guesser
Fifth graders develop strategies for estimating ages, and illustrate results by graphing and interpreting scatter plots to compare x and y coordinates.
Curated OER
Modeling Population Growth
Learners investigate the reasons for taking a census and determine the problems that are involved in the process. They examine the population figure for Montana and Lake county before using the information to complete the included...
Curated OER
Slopes and Linear Equations
Young scholars find the slopes of linear functions. In this graphing instructional activity, students analyze linear equations and calculate the slope of the line. They graph a line given the slope and y-intercept.
Alabama Learning Exchange
Investigating School Safety and Slope
Learners investigate the slope of various stairways through a "news report" approach and employ mathematical knowledge of applied slope to report on wheelchair accessibility and adherence to Americans with Disabilities Act. They...
Curated OER
Inverse Relations and Functions
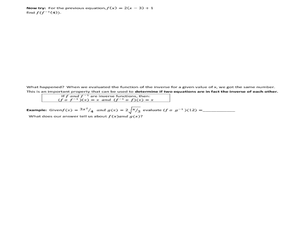
In this algebra worksheets, students find the inverse of a given function by switching the y with the x. They graph the different functions and identify the difference. This learning exercise includes thoughtful questions and worked...
Curated OER
How Far Will It Roll?
Learners construct a car with the longest roll using a ramp. They construct Lego cars, modify the wheel sizes and car configurations to evaluate which car design rolls the longest distance, develop a graph, and complete a worksheet.
Curated OER
Car Maze competition
Young scholars use graphs to calibrate an RCX car. They must then program the car to traverse a maze using their calibrations
Curated OER
Standard Linear Form
Ninth graders identify and describe the x-intercept as the place where the line crosses the x-axis as it applies to football. They create their own differentiations to reinforce the distinction between the x-intercept and the...


