Curated OER
Angles Formed By Parallel Lines
Young scholars explore the concept of angles formed by parallel lines.They graph two parallel lines cut by a transversal, then measure the angles formed by the transversal and record the data in a table. Learners make conjectures about...
Curated OER
Creek Detectives WISE On-line Research Community
Students investigate ways people cause harm to the environment. In this environmental lesson, students explore a case study on the Internet. Students explore all of the online activities and collect data for a presentation.
Curated OER
Using Excel to Draw a Best Fit Line
Students create line graphs for given data in Microsoft Excel. Students follow step by step instructions on how to create their graph, including how to create a trend line. Students print graphs without trend lines and manually draw...
Curated OER
Temperature Line Graphs
For this temperature worksheet, students create 3 line graphs from data tables showing dates and recorded temperatures. This worksheet includes an answer key.
Curated OER
Using Data Analysis to Review Linear Functions
Using either data provided or data that has been collected, young mathematicians graph linear functions to best fit their scatterplot. They also analyze their data and make predicitons based on the data. This lesson is intended as a...
Curated OER
Graph and Compare the Adventure's Temperature Vs. Local Temperature
Students explore the concept graphing data. In this graphing data instructional activity, students use weather data from their local weather and some other city and graph them. Students plot the local weather vs. another city. Students...
Curated OER
Let's Line Them Up!
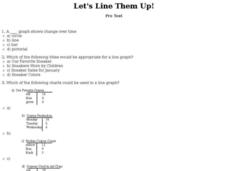
For this line graph worksheet, students read through the problems about graphing and line graphs. Students select the best answer to solve the 10 online questions.
Curated OER
Graphing Ordered Pairs
Here is graphing worksheet which has pupils graph ordered pairs and label the axis. They graph five ordered pairs and then interpret the data in the graph.
Texas Instruments
Finding Linear Models Part III
Explore linear functions! In this Algebra I lesson, mathematicians graph data in a scatter plot and use a graphing calculator to find a linear regression and/or a median-median line. They use the model to make predictions.
Curated OER
Speed
Fifth and sixth graders practice working in pairs to determine whether they can walk with constant speed. They test themselves, collect their data, draw graphs with their data collected, manipulate the data, and then draw conclusions...
EngageNY
Analyzing Residuals (Part 1)
Just how far off is the least squares line? Using a graphing calculator, individuals or pairs create residual plots in order to determine how well a best fit line models data. Three examples walk through the calculator procedure of...
Curated OER
Shaquille O'Neal Hand/Foot Span
Shaquille O'Neal has huge hands and feet, and learners will use those two measurements to practice collecting and extrapolating data using ratios. They record the measurement of foot and hand span of several of their classmates, then...
Curated OER
Nutrition and Food Security
Examine the three basic nutrients and their effects on the body. Fifth graders will research data to construct a bar graph and then demonstrate the relationship between malnutrition and food security. This is a very comprehensive...
Curated OER
Busted Bubbles
Using the scientific method, and bubble gum, learners conduct a motivating experiment. After conducting a series of tests involving bubble gum, they graph and analyze their results. This is the type of activity everyone loves.
Achieve
BMI Calculations
Obesity is a worldwide concern. Using survey results, learners compare local BMI statistics to celebrity BMI statistics. Scholars create box plots of the data, make observations about the shape and spread of the data, and examine the...
Statistics Education Web
Saga of Survival (Using Data about Donner Party to Illustrate Descriptive Statistics)
What did gender have to do with the survival rates of the Donner Party? Using comparative box plots, classes compare the ages of the survivors and nonsurvivors. Using the same method, individuals make conclusions about the...
CK-12 Foundation
Understand and Create Histograms: Car Sales
Create a history of car sales. Pupils create a histogram/bar graph to show the number of car sales made during the week. Using the data display, learners calculate numerical summaries of the data and find the percent of cars sold during...
University of California
Seasons Lab Book
Unlock the mystery behind seasonal change with a collection of worksheets and activities. Whether they are drawing pictures of Earth's orbit around the sun or graphing the temperature and daylight hours of different locations...
US Department of Commerce
Educational Attainment and Marriage Age - Testing a Correlation Coefficient's Significance
Do women with college degrees get married later? Using a provided scatter plot of the percentage of women who earn bachelor's degrees and the median age at which women first get married over time, pupils conduct a linear regression...
Curated OER
Pictures of Data: Post Test
In this data worksheet, students answer multiple choice questions about charts and graphs. Students answer 10 questions total.
Illustrative Mathematics
Robot Races
Analyze data on a graph to answer three questions after a robot race. Learners practice comparing ratios and reading points on a graph. Answers may vary on the last question based on accuracy of graphing. Use the lesson along with...
Curated OER
Make a Frequency Table and a Histogram for a Given Set of Data
In this data recording and data organization activity, students create one frequency table and one histogram for a given list of data. Explanations and examples for frequency tables and histograms are given.
Curated OER
Graphing Lesson Plans
By using hands-on graphing lesson plans students can learn how to collect data, and display the information using graphs.
Curated OER
Graphing Sea Ice Extent in the Arctic and Antarctic
Students graph sea ice data and predict long term trends in the data. In this climate change activity, students use sea ice data from the Arctic and Antarctic to construct line graphs. They use their graphs to predict the effects of...


