Curated OER
Fly Away With Averages
Students discover the process of finding the mean, median, and mode. Through guided practice and problem solving activities, they use a computer program to input data and create a graph. Graph data is used to calculate the mean,...
Curated OER
You mean college costs that much?
Seventh graders collect, organize, and analyze data as they research colleges on the Internet. They graph their collected data on a line graph and use a spreadsheet on Microsoft Excel in order to organize the data.
Curated OER
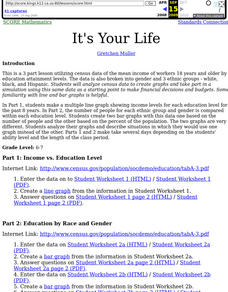
It's Your Life
Students make a multiple line graph showing income levels for each education level for the past 8 years and the number of people for each ethnic group and gender is compared within each education level.
Curated OER
Mapping the Ocean Floor
Students construct and interpret a line graph of ocean floor depth and a bar graph comparing the height/depth of several well-known natural and man-made objects and places. In addition, they calculate the depth of two points using sonar...
Curated OER
Scientific Method- "The Big Ahah"
Students experiment with water, dropper and a coin to study the scientific method. In this scientific method lesson plan, students are in groups, each with a coin, water and a dropper. They investigate how many drops of water can fit on...
Curated OER
Energy and Changes of State
Students complete a variety of labs to help them explain how energy affects the changes in states of matter. They also be required to collect and record data, graph data, and apply interpretations of that data.
Curated OER
Conduction, Convection, Radiation, Oh My!
Young scholars draw a line graph, and use graphing as a tool to discover more about conduction, convection and radiation. They should design their own experiment using heat sensitive paper to show they explain these 3 processes.
Curated OER
Domino Dash
In this speed worksheet, students use dominoes to measure the average speed of rows falling over. Students make a line graph to show the relationship between the length of the domino row and the time. Students answer 8 questions about...
Curated OER
Cities
Students examine U.S. Census figures. In this urban centers lesson plan, students compare city populations across the span of 50 years. Students create line graphs based on the data.
Curated OER
Show Me!
Students analyze and interpret graphs. In this graphing lesson, students view a video and construct their own graphs (line, circle, bar) from given sets of data.
Curated OER
Positive Future Fair Project
Ninth graders view the film "Pay It Forward" and discuss what kind of public campaign is needed to move people to positive action. They consider different ways of presenting information (graphs, visual displays, etc.) as tools for...
Curated OER
Bird Feeding and Migration Observation
Students research bird migration and build a bird house. In this bird lesson plan, students research the birds in their area and where they migrate to. They also build their own bird house and record data on what kinds of birds come to...
Curated OER
Get a Half Life!
Eighth graders use M&M's to experiment with data. They use a graphing calculator to determine the best equation for their data; linear, quadratic or exponential. They analyze the data to find the half-life of their M&M's.
Curated OER
My Peanut Butter is Better Than Yours!
Young scholars explore the concept of statistical data. In this statistical data lesson, students read an article about the dangers of peanut butter to those who are allergic. Young scholars perform a taste test of two different brands...
Curated OER
Student Heights
Students measure the heights of their fellow classmates and create a box and whisker plot to display the data. In this measurement lesson plan, students analyze the data and record results.
Curated OER
Stemmin'-n-Leafin'
Learners make stem and leaf charts to determine the measures of central tendency using test score data. They analyze the data to draw inferences which they share with the class. They complete the associated worksheets.
Curated OER
Growing Plants
Students grow plants and track their growth over time. For this growing plants lesson, students plant seedlings and chart their growth in a data analysis activity.
Curated OER
Spaghetti Bridges
Eighth graders experiment with building bridges of spaghetti, pennies, and a cup to determine how varying the number of spagetti pieces affects the strength of the bridge. They graph their results and interpret the data.
Curated OER
Bar and Histograms (What Would You Use: Part 1)
Young scholars practice creating bar graphs using a given set of data. Using the same data, they create a group frequency chart and histograms. They must decide the best graph for the given set of data. They share their graphs with...
Curated OER
Graphing in Science
Students manipulate and interpret data. They are given a dataset from a described experiment and interpret the data. A "How to Sheet for graphing" is included in lesson plan.
Curated OER
Skittles, Taste the Rainbow
Fifth graders learn and then demonstrate their knowledge of a bar and a circle graph using the classroom data. Students are given a pack of skittles candy. Students create a bar and circle graph indicating the results of the contents of...
Curated OER
ou are the Researcher!
Students conduct a census at school. They collect data, tally it, and create a frequency table. Students display their data in three different types of graphs. They write complete sentences describing the graph.
Curated OER
Using Diagrams in Problem Solutions
Students use tables, graphs and diagrams to collect data. In this problem solving with diagrams lesson plan, students construct their own tables and graphs containing information they gather from a drawing. They also make a Venn Diagram...
Curated OER
Race Track (Culminating Activity)
Students graph and solve linear equations. In this algebra lesson, students use the slope and y-intercept to graph lines. They relate lines to the real world using different applications.


