Curated OER
MAISA and the REMC Association of Michigan
Students complete online research to study geography's impact on weather. In this geography and weather lesson, students research weather in their city for ten days using an online website. Students bookmark the site, enter data into a...
Curated OER
Integers in the Weather
Middle schoolers engage in a clever lesson that combines meteorology with mathematical thinking. They use integers in relation to high and low temperatures that they record. They use a spreadsheet of weather data, a computer, and gain...
WK Kellogg Biological Station
Plotting Phenology
Finally, a worksheet that involves more than filling in some blanks. Your budding ecologists must graph and analyze three sets of data, then synthesize the information as they think about the impacts of plant reproduction on insects and...
Curated OER
Mean Absolute Deviation in Dot Plots
The lesson focuses on the ideas of dot plot representations and the mean absolute deviation of data sets.
Curated OER
Algebra 1
Students study the functional relationships of a variety of problems. In this functional relationship lesson, students determine the dependent and independent quantities of a given set of data. Students record the data and write it in...
Curated OER
Modeling Linear Relationships
Young scholars graph lines using the slope and y-intercept. In this algebra lesson, students create data using tables and equations. They use their data to make predictions and draw conclusion.
Virginia Department of Education
Slippery Slope
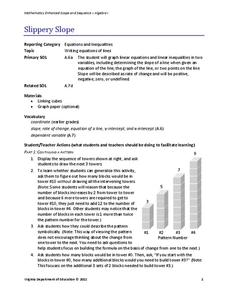
Explore slope using geometric patterns. Young mathematicians investigate towers built from cubes to develop a linear pattern. They move the data to a coordinate plane to connect the pattern to slopes.
Curated OER
Using Negative Numbers
Fourth graders explore negative numbers with this resource. They discuss positive and negative numbers by counting who is present and absent, placing numbers on a number line, and graphing temperatures. Using a variety of activities,...
Curated OER
Why Doesn't My New Shirt Fit?
Learners test Leonardo da Vinci's view of the human body by measuring various body parts using a tape measure. They create a data table and a scatter plot and then analyze and interpret the results using a graphing calculator.
Curated OER
Drug Sales Soar - Rate of Change
In this prescription drug learning exercise, students answer short answer questions and create graphs on the sales of prescription drugs over a five year span. Students complete six questions.
Curated OER
Old Glory
Learners utilize mathematical concepts such as: measurement, ratio and proportion and geometric probability to analyze the components of the U.S. Flag. They collect, organize and interpret data by constructing charts, tables and graphs...
Curated OER
Investigation - Looking For Triangles
Seventh graders investigate a series of triangles, looking for patterns and generalizing what they have found. They analyze the pattern data and organize it into a table and graph. Students identify the relationship and discover the rule...
Curated OER
Two-Variable Linear Inequalities
Here is an engaging instructional activity on solving equations with two variables. Have the class rewrite linear equations in the slope intercept form, y=mx + b. They graph the lines using the slope and y-intercepts.
Curated OER
How Mountains Shape Climate
Students use raw data to make a climatograph; they explain the process of orographic precipitation and the concept of a rain shadow.
Curated OER
Pendulums
First-time physicists experiment with pendulums in this physics lesson. They vary the weight of the bob, record how long each takes to complete ten period swings, and then calculate the time for one period. They repeat the procedure,...
Curated OER
Fame, Fortune, and Philanthropy
With your middle schoolers, develop concepts such as philanthropy, civic responsibility, community service, and common good. Discuss famous philanthropists and what we can each give of our time, talent and treasure to better our...
Curated OER
Hypothesis Testing
Learners investigate the finding of a hypothesis and how it can be tested.For the experiment they will be using the concept of probability. Students design an experiment and test the hypothesis. Then the results are graphed showing the...
Curated OER
Mathematics Witing: Algebraic Processes and Its Connections to Geometry
Students, using manipulatives, determine how many different ways there are to arrange 3 and 4 objects. They organize and record their arrangements. Students investigate the pattern generated by 3 and 4 objects, they predict how many ways...
Curated OER
Mud in the Water
Sixth graders investigate erosion. In this erosion activity, 6th graders explore how farming changes the environment. Students construct an erosion model and research ways to protect the soil from excess mud generated by farming.
Curated OER
Temperature Comparisons
Students practice plotting temperature data points on a line graph in groups and examine the temperature differences at the same time of year. They graph the temperatures in Lannon, WI, and Mitchell's Plain, SA. After the data has been...
Curated OER
Variation 2
Seventh graders use previously completed graphs. They discuss what the graph tells them. They discuss height, and discuss the range of the class height. Students graph data of their height with a bar graph, and repeat with eye color.
Curated OER
Locating the Salt Front
Learners use Hudson River salinity data to create a line
graph that shows the location of the salt front, and use math
skills to explore how this location varies over time. They use the graph to estimate the location of the salt front...
Curated OER
Newton's Third Law and Aircraft Propulsion
Learners research propulsion, graph data, and interpret the results.
Curated OER
The Dead Zone: A Marine Horror Story
Students graph dissolved oxygen versus depth using data taken from NECOP Program. In this marine science lesson, students explain the causes of hypoxia. They recommend possible solutions to this problem.


