Virginia Department of Education
Equations of Lines
Scholars connect slope-intercept form and standard form to the values of m and b by first matching a set of cards that have slope-intercept form, standard form, values of m, values of b, and graphs of linear equations. They then...
West Contra Costa Unified School District
Graphing Family of Functions
Functions have families, too. Learners first graph the parent functions for linear, quadratic, and cubic functions, and then use vertical translations to graph families of functions.
Virginia Department of Education
Line of Best Fit
Pupils work through a guided activity on fitting a linear equation to a set of data by entering the data into a calculator and trying to envision a line of best fit. They then have the calculator determine the least-squares line and...
EngageNY
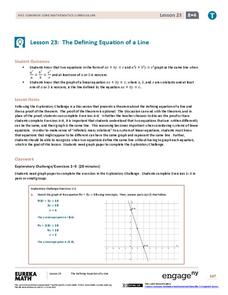
The Defining Equation of a Line
They appear to be different, yet they are the same line. Part 24 out of 33 lessons provides a theorem about the relationships of coefficients of equivalent linear equations. Pupils use the theorem to determine whether two equations are...
EngageNY
Vectors and the Equation of a Line
Represent linear equations in both two and three dimensions using parametric equations. Learners write parametric equations for linear equations in both two and three variables. They graph and convert the parametric equations to...
West Contra Costa Unified School District
Correlation and Line of Best Fit
Computers are useful for more than just surfing the Internet. Pupils first investigate scatter plots and estimate correlation coefficients. Next, they use Microsoft Excel to create scatter plots and determine correlation...
West Contra Costa Unified School District
Graphing Piecewise Functions
Step up to learn about step functions. The instructional activity, designed for high schoolers, first covers piecewise functions and how to draw their graphs. It then introduces step functions, including the greatest integer...
Mt. San Antonio Collage
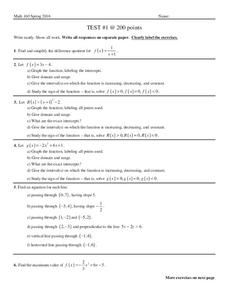
Test 1: Graphing Functions
Graph the night away with all the different types of functions provided in the activity. Linear, quadratic, and rational all ask for graphs, domain and range and other key factors about the functions.
Willow Tree
Approximating a Line of Best Fit
You may be able to see patterns visually, but mathematics quantifies them. Here learners find correlation in scatterplots and write equations to represent that relationship. They fit a line to the data, find two points on the line, and...
EngageNY
The Computation of the Slope of a Non-Vertical Line
Determine the slope when the unit rate is difficult to see. The 17th part of a 33-part series presents a situation that calls for a method to calculate the slope for any two points. It provides examples when the slope is hard to...
Mathematics Assessment Project
Temperatures
As a middle school assessment task, learners first examine line graphs of monthly temperatures for two locations, and then match box plots to each line plot.
Education Development Center
Points, Slopes, and Lines
Before graphing and finding distances, learners investigate the coordinate plane and look at patterns related to plotted points. Points are plotted and the goal is to look at the horizontal and vertical distances between coordinates and...
Ohio Literacy Resource Center
Solving Systems of Linear Equations Graphing
Do you need to graph lines to see the point? A thorough lesson plan provides comprehensive instruction focused on solving systems of equations by graphing. Resources include guided practice worksheet, skill practice worksheet,...
Charleston School District
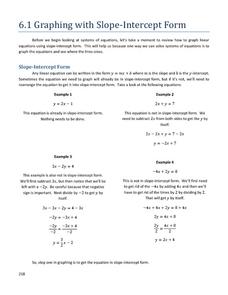
Graphing with Slope-Intercept Form
Work on graphing linear equations using the provided materials. The print and video lesson thoroughly review the concepts related to graphing linear equations in slope-intercept and standard form. The materials prepare learners for...
Curated OER
Animal Brains
Do big bodies make big brains? Let your learners decide whether there is an association between body weight and brain weight by putting the data from different animals into a scatterplot. They can remove any outliers and then make a line...
Willow Tree
Line Plots
You can't see patterns in a jumble of numbers ... so organize them! Learners take a set of data and use a line plot to organize the numbers. From the line plot, they find minimum, maximum, mean, and make other conclusions about the...
EngageNY
Rational Numbers on the Number Line
Individuals learn how to plot rational numbers on the number line in the sixth lesson of a 21-part module. They identify appropriate units and determine opposites of rational numbers.
Baylor College
Air: The Math Link
Inflate this unit on the science of air with these math skills practice and word problems. Accompanying the children's story Mr. Slaptail's Secret, this resource covers a wide range of math topics including the four basic...
Curated OER
Write the equation of a line, given slope and a point
Young mathematicians write equations of lines in this algebra instructional activity. They solve linear equations into the slope intercept form. Next, they graph the lines using the slope and the y-intercept, and they write equations for...
Curated OER
Practice Finding the Equation of a Line
Practice finding the equation of a line with this algebra lesson. Middle schoolers are given a pair of coordinate points representing two points and are asked to write the equation of a line. Then, they are given an equation and asked to...
National Security Agency
Are You Ready to Call the Guinness Book of Records?
Learners design questions that can be answered by collecting data. In this line-plot instructional activity, pupils collect data and graph on a line plot on world records. An abundant supply of teacher support is provided in this resource.
Curated OER
Data Collection
Students write a journal exercise that relates to pets. They collect information from each other in order to practice making and interpreting bar graphs. They Continue building different kinds of graphs with the group.
Curated OER
Real Misleading Graphs
Students identify real graphs and misleading graphs. In this algebra lesson, students surf the Internet for real life scenarios where graphs are used in a misleading way as well as in a correct way.
Curated OER
Organizing Data
For this organizing data worksheet, 7th graders solve seven different types of problems related to data. They first identify the type of data as categorical, discrete or continuous from the information given. Then, students use Excel to...
Other popular searches
- Double Line Graphs
- Graphs. Line Graphs
- Bar and Line Graphs
- Interpreting Line Graphs
- Making Line Graphs
- Reading Line Graphs
- Analyzing Line Graphs
- Creating Line Graphs
- Number Line Graphs
- Reading Double Line Graphs
- Straight Line Graphs
- Bar Graphs Line Graphs


