Curated OER
Organizing Data
In this organizing data worksheet, 7th graders solve seven different types of problems related to data. They first identify the type of data as categorical, discrete or continuous from the information given. Then, students use Excel to...
Curated OER
Charts and Graphs
Fifth graders interpret data into graphs and percentages. In this organizing data lesson, 5th graders discuss bar, circle and line graphs. Students complete bar graph and apply probability using the results.
Curated OER
Understanding Statistics
In this statistics worksheet, students examine and interpret pictographs and line graphs. Students analyze the provided data in order to create bar graphs, circle graphs, and box and whisker plots. The nine page worksheet accompanies a...
Curated OER
Which Graph is best?
Students use commercial software to organize and visually display data to draw conclusions; students use graphing software to create several types of graphs illustrating the number of each color of M&M's in one bag.
Curated OER
Straight Line Graphs
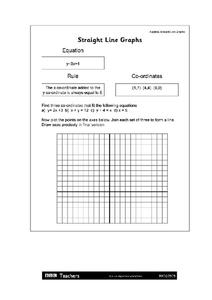
In this straight line graph instructional activity, students identify linear equations. They plot points of given problems. This one-page instructional activity contains 3 problems.
Curated OER
Graphs Review
Seventh graders review different types of graphs such as bar graphs, line graphs, box & whisker plots. As a class, they read a story and construct graphs to solve the data in the story. Students play "Graph Jeopardy" which requires...
Curated OER
Write the Equation of the Line for Four Given Graphs
This straight line worksheet, has upper graders write the equation of the straight line for four given graphs. Be happy, solutions are provided!
Curated OER
Line 'Em Up!
Students find coordinate points on a grid and create a line graph with those points. This lesson should ideally be used during a unit on various types of graphs. They make and use coordinate systems to specify locations and to describe...
Curated OER
Algebra I - Worksheet G12: Graphing Lines
In this graphing lines worksheet, students graph 28 lines given various data. Students graph lines given two points, a point and slope, and a line perpendicular or parallel to a point.
Curated OER
Energy Worksheet #1
A graph of Earth's average monthly temperatures from 1990 to 1994 is posted across the top of the page for meteorology masters to analyze. Five multiple choice questions are asked regarding temperature variation. This does not have to be...
Curated OER
Graphing
Students collect data to create different types of graphs-line, pie, and bar graphs. They use StarOffice 6.0 to create graphs.
Curated OER
An "Average" Golf Score
Ninth graders investigate mean, median, and mode. In this mean, median, and mode activity, 9th graders research gold data for the top ten scores in two golf tournaments. Students make tables and graphs of the data. Students determine...
Curated OER
Unit 8 - Statistical Diagrams
In this statistical diagrams worksheet, students solve 30 short answer problems. Students find the mean of a set of numbers and read/interpret a graph to answer questions. Students determine the x-values that satisfy a y-value criteria,...
Curated OER
Equation of a Straight Line Worksheet
In this equation of a straight line worksheet, high schoolers find the equation of 4 lines in slope intercept form. Students produce the linear equation of a line given its' graph.
Curated OER
Graphing Difference
Students use problem solving skills to reason, predict and problem solve through exploration. They recognize a way in which they are different from their peers and create a graph that shows these differences.
Math Worksheets 4 Kids
Graph Using Number Line
In this algebra activity, students solve linear inequalities and graph their solution on a number line using the inequality signs correctly. There are 5 questions with an answer key.
Curated OER
Reading and Sketching Graphs
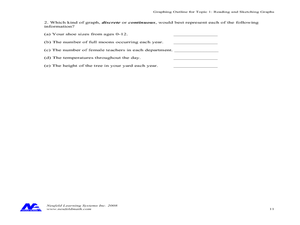
In this graphs worksheet, students answer 15 multistep questions about graphs. Students determine distance traveled, time, velocity, and create scenarios to fit the graph.
Curated OER
Lesson 10: Graphs
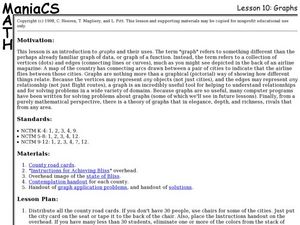
Students explore graph theory. In this geometry lesson, graphs are used to solve problems in a variety of domains. In this lesson the term graph refers to a collection of vertices and edges used to depict travel routes.
Curated OER
Presentation of Quantitative Data- Vertical Line Diagrams
In this quantitative data worksheet, students examine how vertical line diagrams can be used to display discrete quantitative data. They read about the use of tally charts to create vertical line graphs that display the data. They...
Illustrative Mathematics
Proportional Relationships, Lines, and Linear Equations
The resource is a good introduction to what makes a proportional relationship between two lines. Discuss the similarities of both lines and the possibility of intersection. Use this opportunity to list other acceptable forms of each...
Balanced Assessment
Time Line
Use a graph to tell a story! Given a graph, young scientists create a story to match. They must provide their own axes labels and description of the scenario. The graph has increasing, decreasing, and constant sections.
Houghton Mifflin Harcourt
Four-Quadrant Grid
Give your graphers a complete grid to neatly organize their coordinates and lines without having to draw one on their own. This four-quadrant grid provides labeled markers for each line up to -10 and +10 in all directions.
EngageNY
Graphs of Piecewise Linear Functions
Everybody loves video day! Grab your class's attention with this well-designed and engaging resource about graphing. The video introduces a scenario that will be graphed with a piecewise function, then makes a connection to domain...
EngageNY
Analyzing a Graph
Collaborative groups utilize their knowledge of parent functions and transformations to determine the equations associated with graphs. The graph is then related to the scenario it represents.
Other popular searches
- Double Line Graphs
- Graphs. Line Graphs
- Bar and Line Graphs
- Interpreting Line Graphs
- Making Line Graphs
- Reading Line Graphs
- Analyzing Line Graphs
- Creating Line Graphs
- Number Line Graphs
- Reading Double Line Graphs
- Straight Line Graphs
- Bar Graphs Line Graphs


