Curated OER
Free Fall Graphing Exercise
Twelfth graders practice their graphing skills in an exercise about acceleration due to gravity. Lesson opens with a demonstration of acceleration due to gravity and a brief discussion. Students complete a worksheet and go over answers...
Curated OER
Graphs of Quadratic Equations
In this graphs of quadratic equations worksheet, 9th graders solve and complete 9 different types of problems. First, they find the x- and y-intercept of each equation by using the quadratic formula. Then, students find the vertex using...
Curated OER
Get the Picture with Graphs
Fifth graders examine line, bar and circle graphs in the newspaper and on the Internet. They complete sketches of graphs with an emphasis on selecting the best model to depict the data collected.
Curated OER
Graphs
Students participate in a lesson exploring the concept of using graphs in various types of mathematical problems. They use negative and positive numbers in order to plot a graph. Students should use a place value chart for a reference...
Curated OER
Functions and the Vertical Line Test
Students explore the concept of functions. In this function lesson, students determine if the graph is a function by using the vertical line test. Students use an applet to explore the vertical line test on a variety of graphs.
Curated OER
Line of Best Fit
Students identify the line of best fit. For this statistics lesson, students collect and analyze data. They calculate the regression equations and identify the different types of correlation.
Curated OER
Equation of a Line
In this equation of a line worksheet, 9th graders solve and complete 4 different multiple choice problems. First, they use the median fit method to determine the equation that most likely represents the line of best fit for the data...
Curated OER
Finding a Line of Best Fit
Pupils engage in the practice of creating a scatter plot with the data obtained from measuring different resting heart rates. The data is used to create the table that is translated into a graph. The lesson gives instructions for the use...
Curated OER
Using Computers to Produce Spreadsheets and Bar Graphs
Students review graphing terminology and how to plot data points, how to input data into a spreadsheet, and how to make a chart using a computer.
Curated OER
Bar Graphs
In this bar graphs worksheet, students, working with a partner, explore how to read and analyze the five answers to one mathematical bar graph.
Curated OER
Making a Bar Graph
In this bar graph worksheet, students analyze a data table and bar graph depicting information about stickers collected. Students answer 5 questions about the data displayed.
Curated OER
Graphs and money
In this graphs and money worksheet, students complete word problems about different kinds of graphs and money in those graphs. Students complete 10 multiple choice problems.
Curated OER
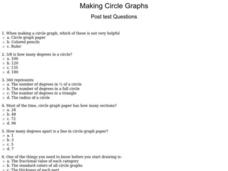
Making Circle Graphs
In this circle graphs instructional activity, students answer multiple choice questions about how to make circle graphs. Students answer 10 questions total.
Curated OER
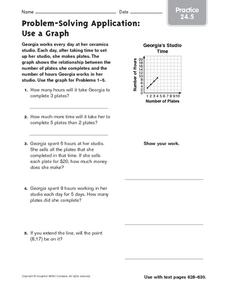
Problem-Solving Application: Use a Graph: Practice
For this graphing coordinates worksheet, students study the graph and the coordinates. Students then answer the five questions about the graph and show their work.
Curated OER
M&M's Candies Worksheet Graph
In this graphing worksheet young scholars will record data on a bar graph. Students will take a bag of M&M's and chart the colors they find inside this bag.
Curated OER
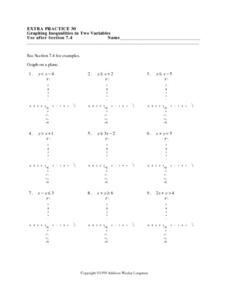
Graphing Inequalities in Two Variables: Extra Practice 30
In this math worksheet, students graph inequalities on a coordinate grid. The eight problems have a coefficient of one for the y variable. Three problems have a negative value for y. The final four problems are horizontal or vertical lines.
Curated OER
The Relationship Between Slope and Perpendicular Lines
In this perpendicular lines worksheet, students explore the relationship between perpendicular lines and slope in eight exercises and two worked examples. The solutions are provided.
Curated OER
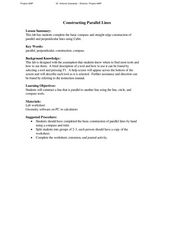
Constructing Parallel Lines
Students construct parallel lines using a protractor and a straightedge. In this geometry activity, students identify the properties of parallel lines. They use Cabri to graph and observe the lines.
Curated OER
Line, Ray, Segment
Learners define vocabulary words. In this geometry lesson, students identify the graph as a line, ray or segments. They understand the properties of each and calculate the distance on a number line.
Curated OER
The Number Line
Eighth graders investigate the order of numbers and how they are located on the number line. They also review the symbols used to compare quantities in order to decipher simple expressions and graph them on the numberline.
Curated OER
Line of Best Fit
Students explore the concept of linear regression. In this linear regression lesson, students do a Barbie bungee activity where they collect linear data. Students plot their data using a scatter plot. Students determine a line of best...
Curated OER
Identifying Lines of Symmetry
Students calculate the lines of symmetry using polygons. In this geometry instructional activity, students graph, compare and estimate using collected data. They identify different attributes to the polygons based on their sides.
Curated OER
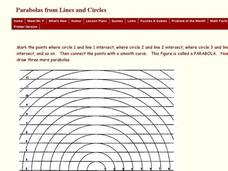
Drawing Three Parabolas from Lines and Circles
In this parabola worksheet, students draw three parabolas by connecting points. The points are formed at the intersection of circles and lines.
Raytheon
Equations and Graphing Review
In this equations and graphing review instructional activity, learners write, graph and solve equations for 62 problems, including a mid-unit review, with answers included.
Other popular searches
- Double Line Graphs
- Graphs. Line Graphs
- Bar and Line Graphs
- Interpreting Line Graphs
- Making Line Graphs
- Reading Line Graphs
- Analyzing Line Graphs
- Creating Line Graphs
- Number Line Graphs
- Reading Double Line Graphs
- Straight Line Graphs
- Bar Graphs Line Graphs


