Curated OER
Heat Absorption
Students examine how heat moves from substance to another. In this heat absorption instructional activity students identify ways that heat is transferred and analyze data.
Curated OER
Self Portrait, What Nerve!
Students conduct an experiment to determine the distance between touch receptor fields in parts of the right-hand side of the body. They enter data into the data table.
Curated OER
pH Testing
Students explore the use of variables in the scientific method. They identify the dependent and independent variables through pH testing. Students construct graphs of their data and analyze their findings.
Physics Classroom
A Critical Lab
Physics lab groups finagle with laser lights to determine the critical angle of refraction for both water and Lucite. Because there are no detailed steps or an answer key for this enlightening exercise, an inexperienced physics...
Curated OER
Living Environment 2004
In this living environment worksheet, students answer 30 multiple choice questions and 42 short answer questions in preparation for the Regents exam.
Curated OER
View Tubes: Student Worksheet
Here is a worksheet that is almost a lesson! In it, learners conduct an experiment in which they determine the size of objects when viewed through viewing tubes. This resource has all of the instructions and tables necessary to complete...
Curated OER
Can you Find the Expression
Students collect data from measurements and weights for this experiment. In this algebra lesson, students analyze graphs they create form their data to find the expression representing the data. They label which graph provided the best...
Curated OER
Holey Clamshells
Students analyze data to make hypotheses and conclusions regarding the predator/prey relationship between moon snail and surf clams.
Curated OER
Trouble in the Troposphere
Students Use data sets from MY NASA DATA to produce graphs comparing monthly and yearly ozone averages of several U.S. cities. They analyze and evaluate the data and predict trends based on the data. In addition, they discuss and...
Curated OER
How Do They Relate? Linear Relationship
Students collect information and use a line to represent it. In this algebra lesson, students investigate real world data to see if it makes a line. They graph the line comparing the relationship of the x axis with that of the y axis.
Curated OER
Dental Detectives
First graders explore the theme of dental health and hygeine. They make tooth loss predictions, count lost teeth, and graph tooth loss. In addition, they listen to dental health stories, read online stories, create spreadsheets, and play...
Curated OER
Conductivity of salt Solutions
Students investigate the concentration level of solutions. For this math/science lesson, students identify three different ionic compounds. They predict the conductivity of each using their collected data.
Curated OER
Paper Parachutes
Students participate in a simulation of a parachute-jump competition by making paper parachutes and then dropping them towards a target on the floor. They measure the distance from the point where the paper parachute lands compared to...
Curated OER
Leaping Lemurs! How far can you jump?
Students watch a segment of the PBS video which show the lemurs' ability to jump. In pairs, students collect measurement data involving each other's length of a standard step, a standing broad jump, and a long jump. They record their...
Curated OER
What Can You Learn From A Mealworm?
Students collect data from mealworms. For this science and math lesson plan, students gain an understanding of collecting metric data using mealworms.
Curated OER
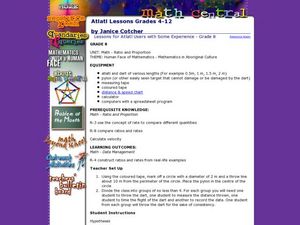
Atlatl Lessons for Grade 8
Eighth graders explore the weapons of the Aboriginal people. In this eight grade math/science lesson, 8th graders collect and analyze data regarding the speed and distance of a dart thrown with an atlatl. Students choose the...
Curated OER
Cool Times with Heat
Learners work with thermometers to complete problems about temperature. They investigate cooling patterns, how location affects temperature, and what happens when water having different temperature is mixed. They measure temperature in...
Computer Science Unplugged
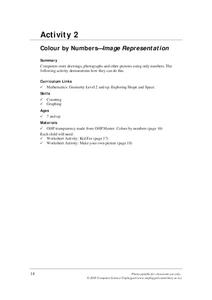
Colour by Numbers–Image Representation
How do computers store and send images? Here's an activity that explains one way a computer can compress image information. Pupils decode run-length coding to produce a black and white image. Pairs then work together to code and decode...
Curated OER
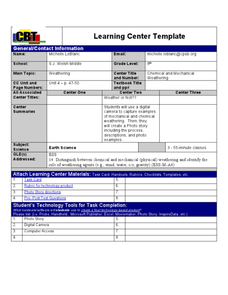
Weather... Or Not
Students observe and discuss the local weather patterns, researching cloud types and weather patterns for cities on the same latitude on the Internet. They record the data for 6-8 weeks on a graph, and make weather predictions for their...
Curated OER
School-Wide Recycling
Students investigate recycling. In this environmental lesson, students design a recycling program for their school. Students collect data about how much recyclable materials they use in one week. Students also survey classmates about how...
Curated OER
Weather: Like It or Not!
Second graders investigate daily weather changes. In this earth science lesson, 2nd graders identify the different terms used to describe weather. They use the outdoor thermometer to record data.
Curated OER
Describing the Motion of a Battery Powered Cars
Students explore distance a toy car travels by changing the amount of batteries used to power the toy car. In this force and motion lesson plan, students calculate the average speed of a car while investigating the power from various...
Curated OER
Between The Extremes
Students analyze graphs for specific properties. In this algebra lesson, students solve equations and graph using the TI calculator. They find the different changes that occur in each graph,including maximum and minimum.
Curated OER
Forces and Motion-The Downhill Racer
Students calculate a toy car's velocity and acceleration. In this force and motion instructional activity, students build ramps and attach a dropper to a toy car, which is released down the ramp. Students calculate and graph velocity and...


