Curated OER
Human Populations Studies: the Ghost of Populations Past
Students compile data on population distribution and develop survivorship curves using information from cemetery tombstones and obituaries. They develop inferences on the changes in population age distribution in their area over time.
Curated OER
Amazing Bean Races
Students experiment with bean growth in varied conditions. In this plant biology lesson, students plant beans in soil and in spun cellulose (absorbent material in diapers) and measure the growth of their seedlings. They collect the data...
Curated OER
Color Enhanced Maps
Learners download or create maps with numerical weather data. They add isolines and color to create regions on their maps. They explore the visual properties of color palettes and create a visualization applying their knowledge.
Curated OER
Eyewitnesses to Change
Students explore recent changes in the Artic's climate that have been observed by Artic residents. They watch videos, take notes and create a concept map. They also look at historical weather data from a specific Artic community. The...
Curated OER
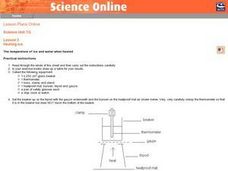
Heating Ice: The temperature of ice and water when heated
Seventh graders read and follow the instructions on the worksheet. They make a table of their results. Students use about 100 cm^3 of water and ice mixture. They heat the water/ice with a Bunsen burner. Temperature is recorded every 30...
Curated OER
Weather
Students participate in a variety of mini-lessons including experiments, literature readings, physical education components, music, data gathering and recording and more to expose them to several themes of weather; i.e. water cycle,...
Curated OER
Heat Loss
Students comprehend how heat loss is affected by exposed surface area. They decide what type of and how many data to
collect. Students decide how the results should be presented. They make a series of accurate observations
Curated OER
What is a Cloud
Third graders study clouds and how they are formed. They write acrostic poems about clouds and analyze and graph temperature data collected during varying degrees of cloud cover.
Curated OER
Introduction to Graphical Representation of Data Sets in Connection with Nuclear Decay
Students record data, make observations, and share in experimentation and discussion of numerical experiments.
Curated OER
Natural Selection Simulation
Students simulate the changes in a natural population of birds or other species. They establish baseline data of population fluctuation for a closed population with a stable food supply. They graph the data to complete their mutations.
Curated OER
Celsius to Fahrenheit
Students convert degrees between two different units. In this algebra instructional activity, students graph linear equations and identify the line of best fit. They use their line of best fit to make predictions given a set of data.
Curated OER
Conduction, Convection, Radiation, Oh My!
Young scholars draw a line graph, and use graphing as a tool to discover more about conduction, convection and radiation. They should design their own experiment using heat sensitive paper to show they explain these 3 processes.
Curated OER
What Are Erosion and Sediments?
Middle schoolers create experiments in class based on the erosion of Earth. In this erosion lesson, students perform a lab in class replicating the effects of erosion. Middle schoolers finally draw their own conclusions based on the...
Curated OER
Graphing Aquatic Insects
Students identify aquatic insects. For this organism lesson, students locate aquatic insects near a local waterway and collect them. Students graph the amount of insects that they collected.
Curated OER
Circle the Earth - Explore Surface Types on a Journey around Earth
Students use CERES percent coverage surface data with a world map in locating landmasses and bodies of water at Earth's Equator.
Curated OER
Tracking Speed
Students collect data for a runner by measuring the time it takes for the runner to run equal distances. After collecting data, students average speeds and accelerations for the runner. Assignment is completed by graphing the data.
Curated OER
Where's the Beach?
Students use beach profile data to analyze how erosion and sediment transport changed seashore slopes. In this geology lesson, students plot the data provided and analyze erosion patterns. They also assess coastal erosion management...
Curated OER
Strike a Pose: Modeling in the Real World (There's Nothing to It!)
Adjust this lesson to fit either beginning or more advanced learners. Build a scatter plot, determine appropriate model (linear, quadratic, exponential), and then extend to evaluate the model with residuals. This problem uses real-world...
Curated OER
Crunching the Numbers on Dating Violence
Students read about potential violent relationships and beliefs about dating. In this relationship lesson plan students use graphs to examine data about healthy realtionshipsand draw conclusions on their results.
Curated OER
Bird Feeding and Migration Observation
Students research bird migration and build a bird house. In this bird lesson plan, students research the birds in their area and where they migrate to. They also build their own bird house and record data on what kinds of birds come to...
Curated OER
Linear and Exponential Growth
Students explore the concept of linear and exponential growth. In this linear and exponential growth lesson, students collect data about China's population. Students model the data to determine if it is linear or exponential.
Curated OER
Supersonic Dream
Young scholars explore how fuel use affects the mass of different planes during flight and graph their results. They determine the per person fuel cost of a transatlantic flight for seven airplanes
Curated OER
Involving Community Members, Parents, and Community Agencies in Student Learning
Students predict and estimate the number of moose shot by people between the years of 1986-1990. They analyze data and statistics, construct bar graphs, and conduct research on the Alaskan moose.
Curated OER
Fishing Line Tests
Students test the strength of fishing lines. In this stress test lesson, students will investigate the breaking point of various fishing lines and graph the results.


