Texas Instruments
Texas Instruments: Trying to Find a 'Best' Fit a Heuristic Approach
In this Derive activity, students determine the optimal location for a warehouse so that it is close to the center of a circle that passes through all the outlets of a store in the region.
CK-12 Foundation
Ck 12: Statistics: Scatter Plots on the Graphing Calculator
[Free Registration/Login may be required to access all resource tools.] This lesson covers finding the equation of best fit using a graphing calculator.
TeachEngineering
Teach Engineering: Walk the Line: A Module on Linear Functions
This module leads students through the process of graphing data and finding a line of best fit while exploring the characteristics of linear equations in algebraic and graphic formats. Then, these topics are connected to real-world...
TeachEngineering
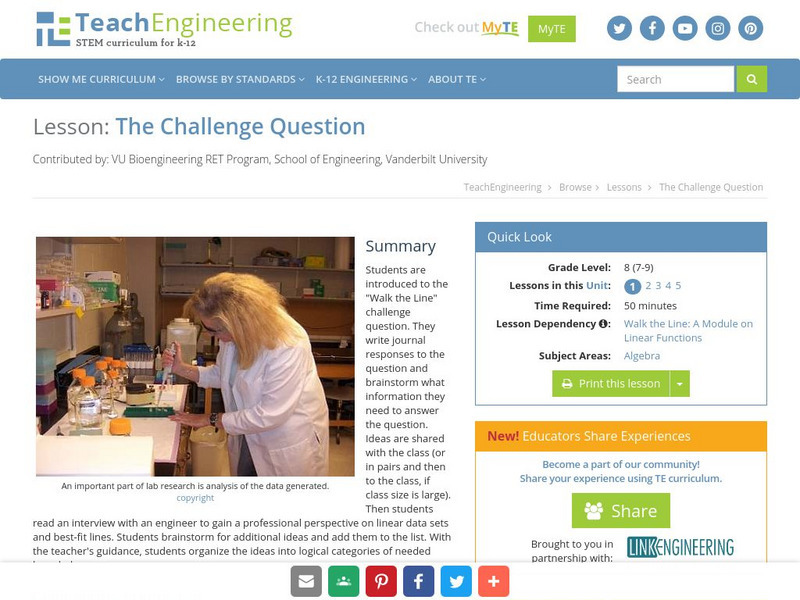
Teach Engineering: The Challenge Question: "Walk the Line"
Students are introduced to the "Walk the Line" challenge question. They are asked to write journal responses to the question and brainstorm what information they need to answer the question. Ideas are shared with the class (or in pairs...
Scholastic
Scholastic: Cultivating Data
Students will understand key concepts of data analysis and their graphic representations. Students will construct and interpret data tables, line plots, box-and-whisker plots and stem-and-leaf plots, scatterplots with line of best fit,...
Texas Instruments
Texas Instruments: Numb3 Rs: How Tall Is the Criminal?
Based off of the hit television show NUMB3RS, this lesson introduces students to lines of best fit and their applications. While the extensions delve into correlation, the main lesson focuses only on collecting data, creating a...
Texas Instruments
Texas Instruments: Numb3 Rs: Dialing Ben
Based off of the hit television show NUMB3RS, this lesson has students try to discover if there has been a significant change in cell phone use over the course of ten days. If so, this "change point" can be detected by creating a line of...
Illustrative Mathematics
Illustrative Mathematics: 8.sp Laptop Battery Charge
This task looks at how long it takes for a laptop battery to fully charge. Students make a scatter plot of data, draw a 'line of best fit,' and predict the time it will take to reach a full charge. Aligns with 8.SP.A.2.
University of Illinois
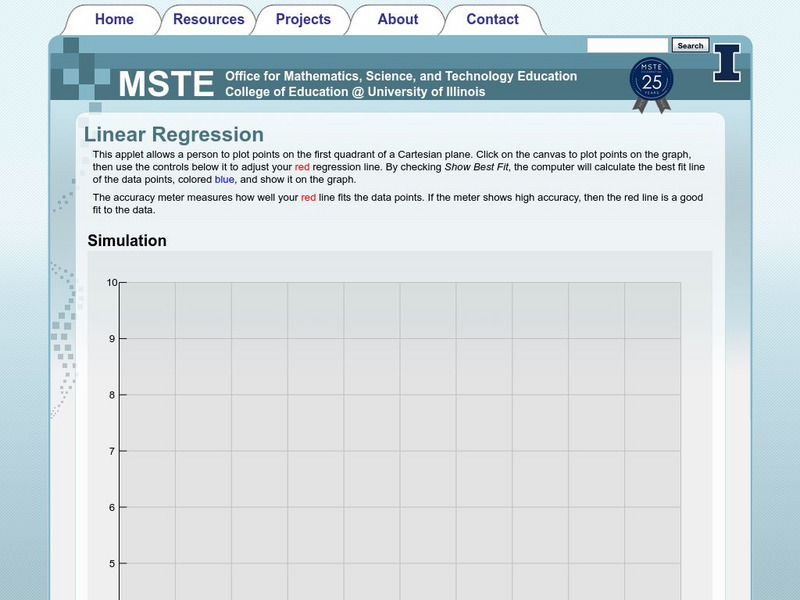
University of Illinois: Linear Regression Applet
This applet allows you to plot up to fifty points and it will display a best fit line and give you the slope of that line.
University of Regina (Canada)
University of Regina: Math Central: Scatter Plots
Three different concepts are examined about scatter plots. Topics featured are collecting data, analyzing scatter plots, and determining a line of "best fit". The lesson has an overview, material, procedures, and evaluation techniques.
University of Regina (Canada)
University of Regina: Math Central: Scatter Plots
Three different concepts are examined about scatter plots. Topics featured are collecting data, analyzing scatter plots, and determining a line of "best fit". The instructional activity has an overview, material, procedures, and...
University of Regina (Canada)
University of Regina: Math Central: Scatter Plots
Three different concepts are examined about scatter plots. Topics featured are collecting data, analyzing scatter plots, and determining a line of "best fit". The lesson has an overview, material, procedures, and evaluation techniques.
University of Regina (Canada)
University of Regina: Math Central: Scatter Plots
Three different concepts are examined about scatter plots. Topics featured are collecting data, analyzing scatter plots, and determining a line of "best fit". The lesson has an overview, material, procedures, and evaluation techniques.
CK-12 Foundation
Ck 12: Algebra: Fitting Lines to Data
[Free Registration/Login may be required to access all resource tools.] Learn how to write equations of best fit lines.
Texas Instruments
Texas Instruments: Getting Started With the Ti Navigator: If the Line Fits
This lesson introduces students to Activity Center and introduces students to the use of symbolic algebra to represent real world situations. They will use Activity Center to contribute equations that model a linear relationship and then...
Shodor Education Foundation
Shodor Interactivate: Regression
Plot a bivariate data set, determine the line of best fit for their data, and then check the accuracy of your line of best fit.
National Council of Teachers of Mathematics
Nctm: Illuminations: Linear Regression I
This applet allows you to investigate a regression line, sometimes known as a "line of best fit."
Texas Instruments
Texas Instruments: What Is Linear Regression?
In this activity, students will explore finding the line of best fit based on the sum of the squares of the residuals and determine what the linear regression line is.
Texas Instruments
Texas Instruments: A Sweet Drink Adventure 7
Students determine how the temperature of water affects the dissolving time of a sugar cube. They create, interpret and analyze graphs of data, find an equation of the line of best fit, and relate slope to rate of change.
Texas Instruments
Texas Instruments: The Phone Bill Problem
The student is given actual data and asked to find a line of best fit and to give "real world" interpretations of the slope and y-intercept. A great introduction to the 83/84 and its features.
Texas Instruments
Texas Instruments: Mc Dougal Littell Algebra 1: Perform Linear Regression
Students can use the TI-84 Plus family to enter data, do a scatter plot and find the line of best fit and explain how they could use it to predict future values.
Texas Instruments
Texas Instruments: Numb3 Rs: Less Is More
Based off of the hit television show NUMB3RS, this two-part lesson begins by having students try to find the line of best fit for a given set of data (strike outs vs. home runs). The second part of the lesson shows how least squares...
Texas Instruments
Texas Instruments: An Exploration of Direct Variation and Linear Regression
Students will use this activity for the following Algebra concepts: Review of Direct Variation; Properties of direct variations; Finding the constant of variations from data sets; Find missing values in data sets both numerically and...
Texas Instruments
Texas Instruments: A Wet Welcome Home Adventure 4
Students perform an experiment that simulates a leaking pipe and gather data on volume of water lost over time. They graph the data collected as a scatter plot, find the equation of the line of best fit, find the total volume of water...
Other popular searches
- Best Fit Line
- Best Fitting Line
- Math Best Fit Line
- Algebra Line of Best Fit
- Best Fit Line Worksheets
- Best Line of Fit


