Radford University
Government Spending
Spend some time with lines of best fit. An informative unit has learners investigate government spending. They research data on poverty, educational spending, social security, and defense spending, and then analyze lines of best fit for...
Flipped Math
Unit 5 Review: Bivariate Data
The data says it's a wrap. Pupils work through four review questions with multiple parts dealing with bivariate data. Questions cover creating and interpreting two-way tables and scatter plots with lines of best fit. Scholars finish up...
Charleston School District
Pre-Test Unit 9: Scatter Plots
What do your classes know about statistics? Use a pre-test to determine their background. Topics include scatter plots and lines of best fit, two-way frequency tables, and modeling with linear equations.
Radford University
Action Bungee Jump
Drop scatter plots onto the class. Teams collect data to determine how far an action figure will fall suspended by rubber bands. Using the collected data, groups determine a line of best fit. Given a drop height, they also determine the...
Radford University
Tuition Cost Activity
Can I afford to go to college? Small groups design a method to research college tuition for several years and make a prediction of costs in 2025. Classmates plot the the data on a scatter plot and graph the line of best fit to make their...
Curated OER
A Wet Welcome Home
Learners investigate data collection and analysis. In this Algebra I activity, students create a scatter plot and find the equation of best fit in a simulation of a leaking water pipe.
Curated OER
Using Data Analysis to Review Linear Functions
Using either data provided or data that has been collected, young mathematicians graph linear functions to best fit their scatterplot. They also analyze their data and make predicitons based on the data. This lesson is intended as a...
Curated OER
When Will We Ever Use This? Predicting Using Graphs
Here are a set of graphing lessons that have a real-world business focus. Math skills include creating a scatter plot or line graph, fitting a line to a scatter plot, and making predictions. These lessons are aimed at an algebra 1...
Curated OER
Barbie Bungee
Middle and high schoolers collect and analyze their data. In this statistics lesson plan, pupils analyze graphs for linear regression as they discuss the relationship of the function to the number of rubber bands and the distance of the...
101 Questions
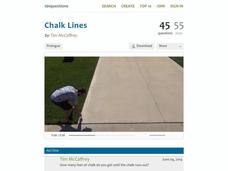
Chalk Lines
Read between the lines to find a solution. Budding mathematicians analyze a situation to solve a problem. They view a video presentation of the problem, brainstorm important information to gather, and write linear equations to find...
Radford University
Can I Create a Line/Curve of Best Fit to Model Water Drainage?
Learners collect data on the amount of water left in a bottle over time. They graph the data to determine whether the scatter plot shows a curved or straight relationship. Group members then determine an equation for the curve of best...
Curated OER
Scatter Diagrams and Curve Fitting
In this Scatter Diagrams and Curve Fitting worksheet, students are guided in how to graph a scatter diagram (plot) and a Best Fit Line using a TI-83 graphing calculator.
CCSS Math Activities
Scatter Diagram
Don't let a great resource scatter to the winds. Pupils analyze two sets of test scores on a scatter plot. They draw a line of best fit and use it to make predictions about the test scores. They also consider any apparent trends in the...
Curated OER
Line Best Fit
Students identify the line of best fit. In this statistics lesson plan, students analyze graphs and plots to identify positive, negative or no correlation. They find the line of best fit for different scatter plots.
Curated OER
Linear Systems: Least Squares Approximations
In this least squares approximation worksheet, students determine the number of solutions a given linear system has. They find the least square error and the equation of a line of best fit for a set of three points. Students find the...
Curated OER
Data Analysis
In this data analysis worksheet, 8th graders solve and complete 4 different problems that include determining the line of best fit for each. First, they write the prediction for an equation for each situation described. Then, students...
Jordan-Granite Consortium
Scatter Diagram
You aced the first test, so your score on the second one shouldn't matter, right? Young pupils first draw a best fit line on a provided scatter plot showing test scores for two different tests. They then evaluate five...
Mathematics Vision Project
Module 9: Modeling Data
How many different ways can you model data? Scholars learn several in the final module in a series of nine. Learners model data with dot plots, box plots, histograms, and scatter plots. They also analyze the data based on the data...
Curated OER
Integration: Statistics, Scatter Plots and Best-Fit Lines
In this math worksheet, students identify the type (if any) of correlation on 6 scatter plots. They use information given on a table to create a scatter plot and identify the type of correlation. Students use the scatter plot to make...
Curated OER
Water Down the Drain
Did you know that leaky faucets waste $10 million worth of water? Conservationists perform an experiment and draw best-fit lines to explore how the US Geological Society determined this value.
Gatsby Charitable Foundation
Four Activities Using Straight Line Graphs
This math packet includes four different activities which puts linear equations and line of best fit in the context of real world applications. Each activity uses a different linear math modeling equation and asks the learners to...
Curated OER
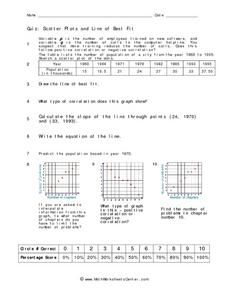
Quiz: Scatter Plots and Line of Best Fit
In this scatter plots and line of best fit activity, students create scatter plots from given sets of data. They answer questions concerning the scatter plot. Students write the equation of a line, identify the type of correlation...
Flipped Math
Correlation
Determine how close the line is to the scatter plot. Clear video instruction shows how to plot a scatter plot and find the best fit line using the linear regression function on a calculator. Pupils use the information from the calculator...
Curated OER
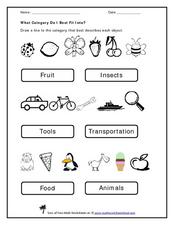
What Category do I Best Fit Into?
Use this pre-reading exercise to help learners sort familiar objects into categories. For each of these three sets, they draw a line from the object to the category in which it belongs. There are two categories for each set. If...
Other popular searches
- Best Fit Line
- Best Fitting Line
- Math Best Fit Line
- Algebra Line of Best Fit
- Best Fit Line Worksheets
- Best Line of Fit


