Statistics Education Web
The United States of Obesity
Mississippi has both the highest obesity and poverty rate in the US. Does the rest of the data show a correlation between the poverty and obesity rate in a state? Learners tackle this question as they practice their skills of regression....
Noyce Foundation
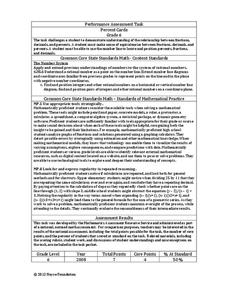
Percent Cards
Explore different representations of numbers. Scholars convert between fractions, decimals, and percents, and then use these conversions to plot the values on a horizontal number line.
Radford University
Sleep and Teen Obesity: Is there a Correlation?
Does the number of calories you eat affect the total time you sleep? Young mathematicians tackle this question by collecting their own data and making comparisons between others in the class through building scatter plots and regression...
Curated OER
Histograms
Young statisticians explore the concept of histograms. They construct histograms of various data such as change in a student's pocket, and guessing on a test. hHey analyze data represented as a histogram and a box plot and compare...
Kuta Software
Points in the Coordinate Plane
Keep young mathematicians on point with this coordinate plane worksheet. From plotting ordered pairs to identifying the quadrant and coordinates of specific points, this resource covers all the basic skills students need to have...
Kenan Fellows
Let's Move
Find a statistical reason for a fresh start. Using a hypothetical scenario, individuals research statistical data of three different cities. Their goal? Find the best statistical reason for a business to move to a new location. Their...
Curated OER
Water Down the Drain
Did you know that leaky faucets waste $10 million worth of water? Conservationists perform an experiment and draw best-fit lines to explore how the US Geological Society determined this value.
Statistics Education Web
Consuming Cola
Caffeine affects your heart rate — or does it? Learners study experimental design while conducting their own experiment. They collect heart rate data after drinking a caffeinated beverage, create a box plot, and draw conclusions....
Statistics Education Web
Saga of Survival (Using Data about Donner Party to Illustrate Descriptive Statistics)
What did gender have to do with the survival rates of the Donner Party? Using comparative box plots, classes compare the ages of the survivors and nonsurvivors. Using the same method, individuals make conclusions about the...
PBL Pathways
College Costs
Predict the year that college costs will double in your state using linear modeling. The first part of this two-part project based learning activity asks young mathematicians to use data from the College Board. They graph the data,...
Math Sphere
Co-Ordinates
Challenge young mathematicians' understanding of the coordinate plane with this series of skills practice worksheets. Offering 10 different exercises that involve identifying ordered pairs,...
EngageNY
End-of-Module Assessment Task - Algebra 2 (Module 1)
A series of assessment tasks require learners to process information and communicate solutions. Topics include graphing parabolas, solving linear-quadratic systems, factoring polynomials, and solving polynomial equations.
National Council of Teachers of Mathematics
National Debt and Wars
Take a functional approach to the national debt. Learners collect information about the national debt by decade and plot the data. They determine whether an exponential curve is a good fit for the data by comparing the percent changes...
Concord Consortium
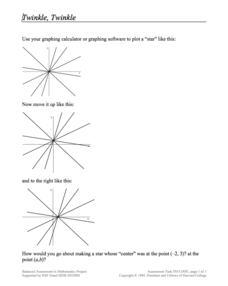
Twinkle, Twinkle
Take a look at a star resource. Young mathematicians use a graphing calculator to draw intersecting lines that look like a star. They then apply translations to move the entire star and also consider what transformations must occur to...
Curated OER
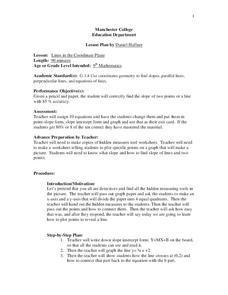
Lines in the Coordinate Plane
Students graph lines in a coordinate plane. In this geometry lesson, students graph lines on a coordinate plane, and identify the slope. They classify the lines as parallel or perpendicular and write an equation of a given line.
Curated OER
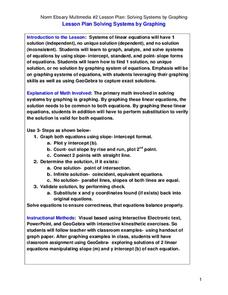
Solving Systems by Graphing
Students solve systems of equation through graphing. In this algebra activity, students solve linear equations and analyze the result to figure out if there is one solution, no solution or infinitely many solutions. They graph their...
Curated OER
Slope of a Line
In this slope of a line worksheet, students read about line graphs and plotting the slope of a line. They read about the rate of change which is represented by the slope. Students practice finding the slope of lines.
Curated OER
Excel temperature Graphs
Students gather data about the weather in Nome, Alaska. In this Nome Temperature lesson plan, students create an excel graph to explore the weather trends in Nome. Students will find the average weather and add a trend line to...
Curated OER
Graphing Linear Equations
In this calculator active graphing worksheet, students graph 12 equations via a calculator and transfer the graphs onto coordinate grids.
Curated OER
Graphs
Students explore graphs and define the different ways they are used to display data. In this algebra lesson, students collect data and plot their data using the correct graph. They draw conclusions from their graphs based on their data.
Curated OER
Coordinate Plotting: Shapes
In this math worksheet, students graph ordered pairs on a coordinate grid. They connect the points to create a geometric shape. This worksheet generator allows teachers to select the size of the grid, the complexity of the shapes, and if...
Curated OER
Box-and-Whisker Plots
Eighth graders measure in feet and inches and convert to explore the relationship between the converted measurements. In this measurement lesson, 8th graders use the whisker and box plot to represent the measurement of a cat. ...
Curated OER
Scatter Diagrams and Curve Fitting
In this Scatter Diagrams and Curve Fitting worksheet, students are guided in how to graph a scatter diagram (plot) and a Best Fit Line using a TI-83 graphing calculator.
Curated OER
Graph and Compare the Adventure's Temperature Vs. Local Temperature
Students explore the concept graphing data. In this graphing data instructional activity, students use weather data from their local weather and some other city and graph them. Students plot the local weather vs. another city. Students...


