Curated OER
Graphing Data from the Chemistry Laboratory
Students graph and analyze data using a spreadsheet.
Curated OER
Motion Graphs
In this motion graphs activity, learners learn about how motion of objects can be described using a graph. Students then answer 10 fill in the blank, 10 short answer, and 5 problems to solve.
Curated OER
Creating Line Graphs
Learners draw line graphs. For this math lesson, students interpret minimum wage data and graph the data in a line graph. Learners predict the next minimum wage and figure the earnings for a 40 hour work week for someone earning the...
Curated OER
Plotting the Ocean Floor
Fourth graders plot points on a graph, connect the dots to make the ocean floor profile and label the topographical features. They utilize a worksheet and a website imbedded in this plan to plot the ocean floor.
Curated OER
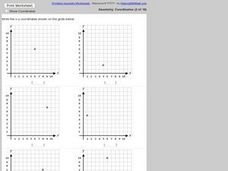
Coordinates Graphing
In this geometry worksheet, students are given points to plot on a coordinate plane. They identify plotted coordinate pairs. There are 10 questions.
Curated OER
Plot and Name Points on a Grid
In this graphing activity, students solve a set of 6 problems, using a given graph to answer questions related to plotting points, units moved in a given directions and coordinates.
Curated OER
Problem-Solving Application: Use a Graph
In this problem solving worksheet, 6th graders use the problem solving steps of understand, plan, solve and look back to answer a graphing question.
Curated OER
Graphing and the Coordinate Plane
Students learn about the Cartesian coordinate plane, understand the four quadrants of the Cartesian coordinate plane, and plot points on the plane. Students read coordinates for a point from a graph and give the ratio of rise over run...
Curated OER
Graphing Climate Information
Seventh graders plot the data for the average monthly precipitation for three cities. They make a graph using a spreadsheet.
Curated OER
Linear Functions-Learn Your Lines
Students solve and graph linear equations. In this algebra lesson plan, students collect and plot data on a coordinate plane. They use the CBL and TI calculator to graph systems of equation.
Curated OER
Getting A Grip On Graphs
Fourth graders investigate the concept of graphing and comparing different types of data using pictographs, line graphs, scatter plots, etc... They gather data and make interpretations while examining the medium of how it is displayed.
Curated OER
Graphing Linear Inequalities
Eighth graders extend skills for representing and solving linear equations to linear inequalities. Lesson activities build understanding and skill by plotting ordered pairs of numbers that either satisfy or do not satisfy a given...
Curated OER
Plotting Grids Using Battleship
Learners coordinate grid points on X and Y axises to plot a physical location. The game of "Battleship is used to present first hand knowledge of this skill.
Curated OER
Graphing Linear Equations
Students graph linear equations. In this algebra lesson, students investigate the price of tolls in different states and create a graph. They analyze their graph and draw conclusions.
Curated OER
Graphing Ordered Pairs
In this math worksheet, students learn to graph ordered pairs. Students examine a graph with 3 labeled points and tell the ordered pairs for each. Students also plot 8 ordered pairs on a graph they draw themselves.
Curated OER
Make a Pass at Me
Students identify different types of functions and units of measurements. In this statistics lesson, students will collect data, graph their data and make predictions about their data. They plot a linear regression graph.
Curated OER
Which Car Should I Buy?
Students use gas mileage of different cars to create T charts, algebraic equations, and graphs to show which gets better mileage. In this gas mileage lesson plan, students use the graph to see which car they should buy.
Curated OER
Coordinates
In this coordinates worksheet, students analyze two maps and identify the coordinates of ten specific locations. Students plot sixteen points on a graph and check their answers online at the end of each exercise.
Curated OER
The Human Population
In this human population worksheet, students are given data about the size of the human population from the 1800s to 1999. They plot the data and answer critical thinking questions about the changes in human population.
Curated OER
One to One Functions
In this one to one functions worksheet, high schoolers solve 27 short answer and graphing problems. Students determine if a function is one to one given a graph or an equation. High schoolers graph functions to determine if it is one...
Curated OER
Parachutes: What a Drag
Sixth graders make 2 different kinds of parachutes and record and graph the time for each one for the different drag forces. In this parachute lesson plan, 6th graders compare the results to the rest of the class of each parachute and...
Curated OER
Simultaneous Equations for Circuit Analysis
In this worksheet, learners use Algebra to plot different solutions to equations and analyze schematics in order to answer a series of 25 open-ended questions about electrical circuits. This worksheet is printable and the answers are...
Curated OER
Linear and Exponential Functions
This comprehensive unit on linear and exponential functions provides numerous clearly-written worksheets. Topics include graphing linear equations, solving systems of equations algebraically and by graphing, identifying the domain and...
Curated OER
Spaghetti Bridges: Student Worksheet
Here is a wonderful activity that allows young engineers to try their hand at designing a bridge out of spaghetti! The learning exercise explains the activity and also provides a graph for keeping track of the results. Very good!


