Curated OER
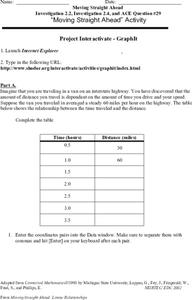
Moving Straight Ahead
In this functions learning exercise, 9th graders solve and complete 24 various types of problems. First, they complete the table with the correct distance for each hour given. Then, students enter the coordinate pairs into the function...
Curated OER
Density of Pennies Lab
In this density of pennies worksheet, student conduct an experiment to determine the metals used in the core of pennies made after 1983. Students design their own experiments using a balance and graph paper to determine the density of...
Curated OER
Operations and Coordinates: The Coordinate System
Students play a "Battleship" type of game to practice graphing on a coordinate grid. In this graphing lesson, students listen as the teacher explains quadrants and ordered pairs. They place their "ships" on the board. The teacher calls...
Curated OER
The Big Bang-Hubble's Law
In this Hubble's law worksheet, students use data for galaxies which include their distance and speed. Students make a graph to show the distance to each galaxy and the speed of each galaxy. They use their graph to answer 4 questions...
Curated OER
Cities
Students examine U.S. Census figures. In this urban centers instructional activity, students compare city populations across the span of 50 years. Students create line graphs based on the data.
Curated OER
Statistics with State Names
Students analyze the number of times each letter in the alphabet is used in the names of the states. For this statistics lesson, students create a stem and leaf plot, box and whisker plot and a histogram to analyze their data.
Curated OER
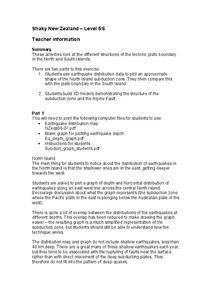
Shaky New Zealand
Students explore Earth science by building a model in class. In this tectonic plate lesson, students identify the impact tectonic shifts have on humans and animals and where the plates and faults lie under New Zealand. Students examine...
Curated OER
Interpreting Data and Statistics
Students define terms and analyze data. In this statistics lesson, students plot their data using bar and line graphs. They analyze their data after they graph it and apply the results to the Great Depression.
Curated OER
Differentiation
Learners explore estimated and exact results for derivatives, tangent lines, implicit differentiation, and symbolic differentiation. The lesson provides examples with solutions and practice problems.
Curated OER
Coordinates
In this geometry activity, 10th graders are given points on a coordinate plane, and they must figure out what the x and y values are. There are 6 graphing question.
Curated OER
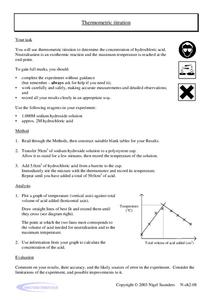
Thermometric Titration
In this thermometric titration worksheet, students titrate hydrochloric acid with sodium hydroxide to determine the concentration of hydrochloric acid. They measure the change in temperature of the solution, plot their data and use the...
Curated OER
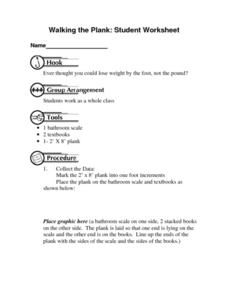
Walking the Plank: Student Worksheet
In this math worksheet, students will work in a group to experiment with the weight of objects when placed at a distance from a scale (using a plank). Students will record and graph their results.
Curated OER
A Simple Thermoetric Titration
In this thermometric titration worksheet, students investigate the changes in temperature when an alkali is neutralized by an acid. Students graph their results from the titration and draw 2 best fit lines on their graph. Where the lines...
Curated OER
Mine Shaft Grade 8 Slope
Eighth graders investigate slopes using real life scenario. In this algebra lesson, 8th graders model and interpret real life data. They plot their data in a coordinate plane and discuss the results with the class.
Curated OER
Naming Points on the Coordinate Plane
In this naming points on the coordinate plane instructional activity, middle schoolers name 6 coordinates off of 6 graphs. Students name the x and y-coordinates of 6 different points in all four quadrants.
Curated OER
Intro to the Coordinate Plane
Students identify the axes, quadrants of the coordinate plane and plot points on the plane. They take notes on the coordinate plane. Students and teacher go over examples of the coordinate plane. As an independent practice students...
Curated OER
Coordinate Connections
Sixth graders complete several activities that involve coordinates and graph paper. They visualize and identify geometric shapes after applying transformations on a coordinate plane. Finally, 6th graders draw and label a coordinate...
Curated OER
The Phone Bill Problem
Students write an equation for a linear function. In this algebra lesson, students collect data, plot it and graph it. They identify the equation of the graphed data and define the slope and y-intercept of the graph.
Curated OER
Strike a Pose: Modeling in the Real World (There's Nothing to It!)
Adjust this lesson to fit either beginning or more advanced learners. Build a scatter plot, determine appropriate model (linear, quadratic, exponential), and then extend to evaluate the model with residuals. This problem uses real-world...
Curated OER
Exploring The Depths!
Fifth graders make a model of the ocean floor. In this ocean characteristics lesson, 5th graders complete a KWL chart about the ocean floor, use the Ocean Depth Data Sheet to create a graph, and create a 3-D model of the ocean floor.
Curated OER
Coordinate Plane
In this algebra worksheet, students investigate the coordinate plane through graphing, plotting and identifying the different quadrants. They identify vertical and horizontal lines in the coordinate plane. There are 10 questions with an...
Curated OER
A Steep Hike
Students explore slope. In this middle school mathematics instructional activity, students analyze and interpret graphs as they investigate slope as a rate of change. Students use a motion detector to collect data as they...
Curated OER
Probability Popsicle Pop-ups
Fourth graders decorate and use popsicle sticks as manipulatives to assist with their learning of probability. They utilize a worksheet imbedded in this plan to organize the results of their experiment. They make a stem and leaf plot...
Curated OER
Rate of Change
Students observe and calculate slopes. In this algebra lesson, students graph equations and determine the pace at which the slope is changing. They use the navigator to see the change as they graph the lines around.


