Curated OER
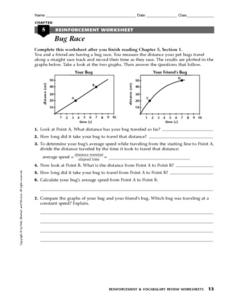
Bug Race
In this motion learning exercise, students compare two graphs showing a bug's distance traveled over time. Students calculate the average speed of the bugs and determine which bug was traveling at a constant speed. This learning exercise...
Curated OER
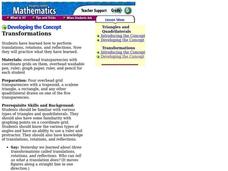
Transformations
Sixth graders discover transformations. In this graphing lesson plan, 6th graders explore visual examples of plotting transformations as they review translations, rotations, and reflections. Students also practice solving problems that...
Curated OER
Linear Functions, Restricted Domains, Infinite Geometric Series, Interconnections
In this math worksheet, learners graph the linear functions in comparison to the inequalities. Then they compare the line segments on the coordinate plane.
Curated OER
Patterns in Nature
In this patterns in nature learning exercise, students read about the Fibonacci Spiral, then follow the directions to plot one on the graph paper and draw the spiral, with links to more information.
Curated OER
Linear Functions
Students solve and graph linear equations. In this algebra instructional activity, students collect data and plot it to create a linear function. They identify the domain and range of each line.
Curated OER
The Closer I Get To You
Pupils explore the law of reflection. Through experimentation and problem solving, they collect and analyze data pertaining to reflection. The data is plotted on a graph and formulas for calculating the x and y values are evaluated.
Curated OER
Saving the Bald Eagle
Students plot on a coordinate plane. In this algebra lesson, students identify points on a coordinate plane and graph lines given coordinate pairs. They create a model as they study bald eagles and their growth and decay.
Curated OER
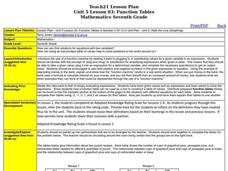
Function Tables
Young scholars identify function using tables of data. In this algebra lesson plan, students create a tale of point and plot on a coordinate plane. They analyze the graph as being a function or not.
Curated OER
Understanding Equations of Functions
Students write equations for different functions. In this algebra lesson plan, students observe data and find the function that goes along with that data. The identify the line of best fit.
Curated OER
What Happened to the Mean and Median
Learners find the mean, median and mode. In hs statistics lesson, students collect, plot and analyze data. The identify the effect the central tendency have on the data and line.
Curated OER
Downtown Landmarks
In this math activity, students find the landmarks that answer the questions asked. They also plot the distances on the number line.
Curated OER
Tally Time
Students create a tally chart. In this math and health instructional activity, students discuss healthy foods and create a tally chart showing the number of students who like to eat healthy foods.
Curated OER
Chart problems involving car defects and customer service departments
In this interactive worksheet, students solve two problems using the charts provided. Students must convey they are able to understand charts and how to read them.
Curated OER
Bird Feeding and Migration Observation
Students research bird migration and build a bird house. In this bird lesson plan, students research the birds in their area and where they migrate to. They also build their own bird house and record data on what kinds of birds come to...
Curated OER
Data and charts
In this data and charts instructional activity, students answer multiple choice questions referring to different charts about mountain heights, breakfast drinks, and more. Students complete 10 multiple choice questions.
Curated OER
Journal of the Stars
Students receive balloons representing the "Life Cycle of the Stars." As the attached script is read, students follow the directions for the color of balloon they are given. Students chart the results for their star. They plot data from...
Curated OER
Surface Meteorological Observation System (SMOS)
Learners investigate local surface weather conditions. They log weather conditions for thirty days, develop a graph, plot cloud cover, and compare/contrast the graphed lines of various weather factors.
Curated OER
Probability Distributions
Students collect and plot data on a graph. In this statistics lesson, students analyze the distribution of a sample and predict the outcome. They find the line of best fit and discuss what would make the sample larger.
Curated OER
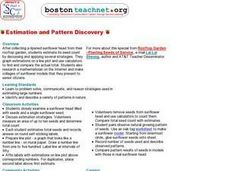
Estimation and Pattern Discovery
Students collect sunflower heads from their community garden. They estimate its seed count using different strategies. They graph their estimations on a graph and use calculators to find the actual total.
Curated OER
The Bigger they Are . . .
Pupils do a variety of data analyses of real-life basketball statistics from the NBA. They chart and graph rebounding, scoring, shot blocking and steals data which are gathered from the newspaper sports section.
Curated OER
Home on the Biome
Fifth graders study six major biomes, graph temperature and rainfall, and present their findings to the class.
Curated OER
Raisin Cane
Learners estimate and record the number of raisins in a snack-size box. They also graph their results and note the differences (+ or -) from their estimate and actual number.
Curated OER
What is a Cloud
Third graders study clouds and how they are formed. They write acrostic poems about clouds and analyze and graph temperature data collected during varying degrees of cloud cover.
Curated OER
Survey and Share
Students practice collecting data by surveying other students. In this data collection lesson plan, students decide on a question and collects data from 15 other students. Eventually the students will end up graphing their results.


