Texas Education Agency
Texas Gateway: Collecting Data and Making Predictions
Given an experimental situation, the student will write linear functions that provide a reasonable fit to data to estimate the solutions and make predictions.
Texas Instruments
Texas Instruments: Mc Dougal Littell Middle School Math: Making Data Displays
Students will create data displays using a scatter plot and a line graph of the data and a circle graph of survey data.
Texas Instruments
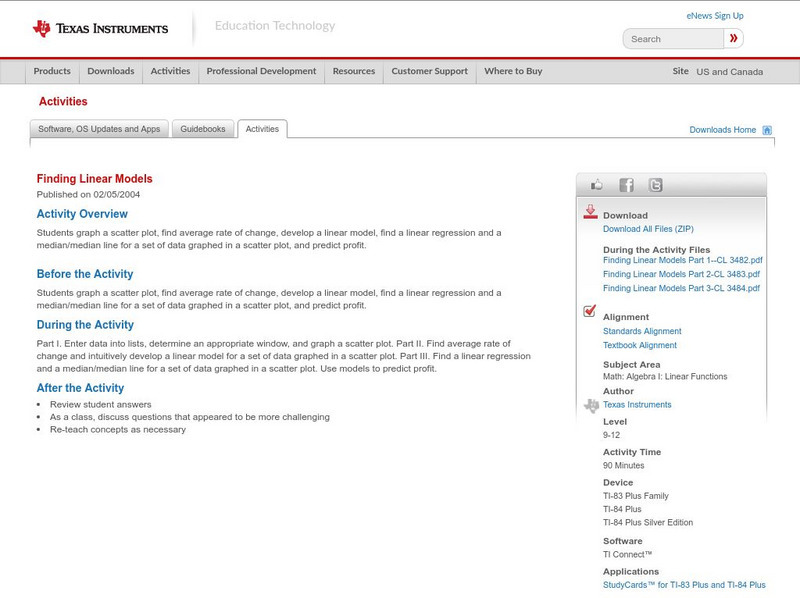
Texas Instruments: Finding Linear Models
Students graph a scatter plot, find average rate of change, develop a linear model, find a linear regression and a median/median line for a set of data graphed in a scatter plot and predict profit.
Texas Instruments
Texas Instruments: Defining the Parabola
The teacher will graph a horizontal line and plot a point using TI-Navigator, and the class will provide the points that create a parabola.
Ministry of Education and Universities of the Region of Murcia (Spain)
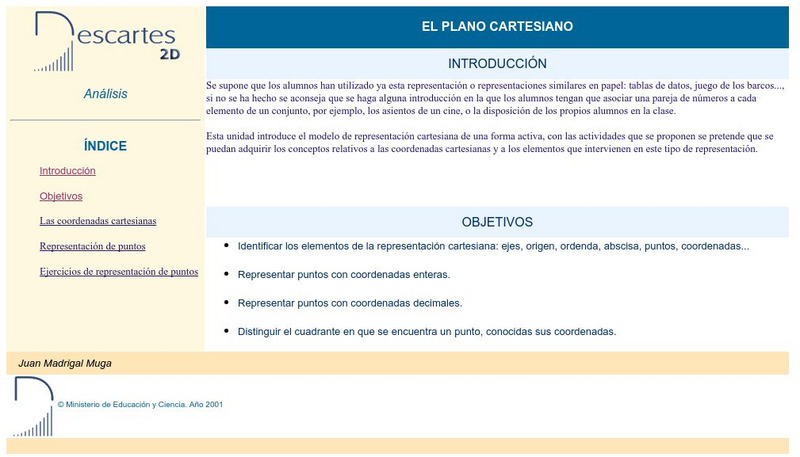
Ministerio De Educacion Y Ciencia: El Plano Cartesino
Interactive activities that will help you plot points on the Cartesian Coordinate Plane.
Khan Academy
Khan Academy: Coordinate Plane Problems in All Four Quadrants
Practice solving word problems by interpreting the meaning of points plotted on an xy coordinate system. Students receive immediate feedback and have the opportunity to try questions repeatedly, watch a video or receive hints.
Math Drills
Math Drills: Statistics and Probability Worksheets
Download these free worksheets to sharpen your skills with statistics and probability. Sheets focus on collecting and organizing data, measures of central tendency (mean, median, mode, and range), and probability.
Other
Stat Soft: Statistics Glossary
Dozens of statistical terms are defined and illustrated in this glossary.
Texas Instruments
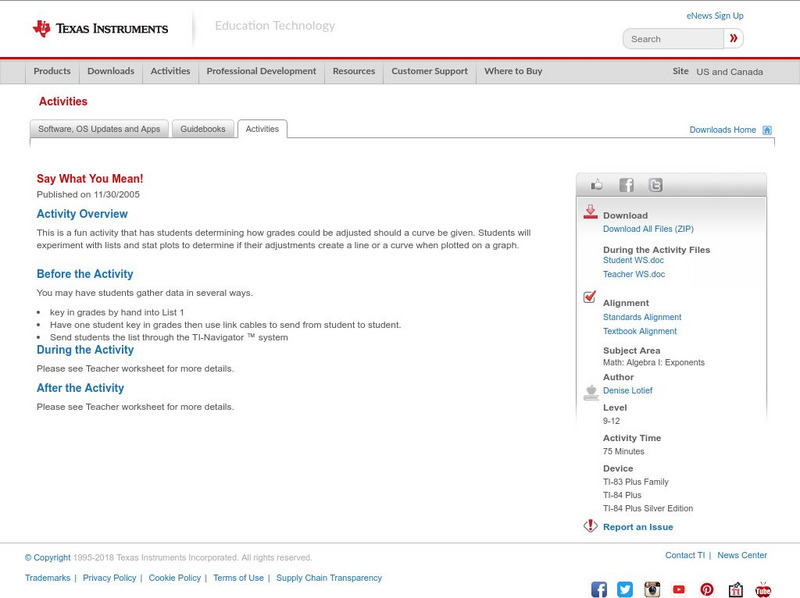
Texas Instruments: Say What You Mean!
This is a fun activity that has students determining how grades could be adjusted should a curve be given. Students will experiment with lists and stat plots to determine if their adjustments create a line or a curve when plotted on a...
Louisiana Department of Education
Louisiana Doe: Louisiana Believes: Eureka Math Parent Guide: Collecting and Displaying Data
A guide to support parents as they work with their students in collecting and displaying data.
Louisiana Department of Education
Louisiana Doe: Louisiana Believes: Eureka Math Parent Guide: Problem Solving With Length, Money, and Data
A guide to support parents as they work with their students with problem solving with length, money, and data.
Oswego City School District
Regents Exam Prep Center: Categorizing Data
Three lessons on different types of data (qualitative, quantitative, univariate, bivariate, biased data) as well as a practice activity and teacher resource.
Cuemath
Cuemath: Data Handling
This comprehensive guide about data handling helps with understanding how the study of data handling and graphical representation of the data along with other tools help us in dealing with numerical data. Includes solved examples and...
EL Education
El Education: A Field Guide to East Bog Swamp
This micro-field guide was created by 5th and 6th graders in Marlboro, Vermont. Groups of 3 or 4 students worked together to investigate their own 3 by 3 foot research plot, over multiple visits, and then created a field guide to their...
Richland Community College
Richland Community College: Math 116 Lecture Notes
This site from the Richland Community College provides the detailed lecture notes to a college algebra course, complete with equations and definitions. Content ranges from "functions and their graphs" to "conics and parametric equations."
McGraw Hill
Glencoe: Interpreting Data Quiz
This is a quiz with five quick questions to check your understanding of how to interpret data. It is self checking.
Texas Instruments
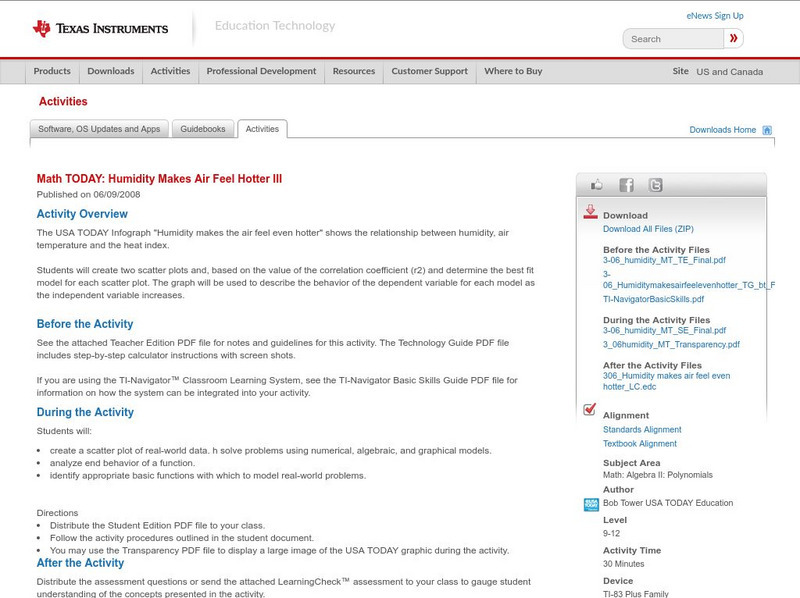
Texas Instruments: Math Today: Humidity Makes Air Feel Hotter Iii
Investigate the relationship among humidity, air temperature, and the heat index while learning about modeling data, evaluating functions, and describing the end behavior of a function. Students will use graphing calculator technology to...
Texas Instruments
Texas Instruments: What Is a Linear Regression?
In this activity, students create lists of data points, plot them on a graph, and determine the regression equation of the best fitting line. They also understand exactly how the linear regression is determined.
Other
Algebra.com: Linear Equation and System Solvers: Solve Linear Systems
This interactive linear system solver allows you to enter two linear equations in general form and then plot the lines and find the answer using either substitution or elimination. The answer is presented with both methods accompanied by...
Georgia State University
Georgia State University: Hyper Physics: Ionization Energies
A concise description of ionization energy, and a line graph that plots the ionization energies of the first 88 elements vs. the atomic numbers.
Curated OER
Georgia State University Hyperphysics: Ionization Energies
A concise description of ionization energy, and a line graph that plots the ionization energies of the first 88 elements vs. the atomic numbers.


