Math Worksheets Land
Halloween Cartesian Art: Bat
Get the class batty over graphing. Young mathematicians plot ordered pairs in all quadrants of a Cartesian plane, and connect the points to create a bat.
Balanced Assessment
Who's Left?
If you're not right-handed, are you wrong-handed? Young statisticians calculate the percentage of left-handed people using a given data set in the assessment task. They plot data on a scatter plot and consider how the line of best fit...
Math Drills
Halloween Cartesian Art: Witch Hat
What is the mystery picture? After plotting points on the first quadrant of a Cartesian coordinate system, young mathematicians connect the points to create a Halloween-themed picture.
NASA
Analyzing Surface Air Temperatures by Latitude: Student Activity
Explore global temperatures from the comfort of your learning place! Meteorologists analyze surface temperatures and anomalies across different latitudes. Investigators evaluate graphs to find temperature differences and answer questions...
Curated OER
Lesson 6-7: Scatter Plots and Equations of Lines
For this scatter plot worksheet, students examine tables and write a linear equation that matches the table. Students graph linear equations. They read scatter plots, determine the trend line, and write a linear equation to match...
Curated OER
Exploring Linear Equations And Scatter Plots - Chapter 5 Review
Young scholars complete rolling stocks experiment, and collect and enter data on the computer. They enter data on graphing calculators, complete scatter plot by hand with line of best fit, and discuss different graphing methods.
Curated OER
Graphing and Analyzing
In this graphing and analyzing worksheet, 9th graders first state if each graph represents a linear or nonlinear relationship. Second, they create a difference table for each set of data presented and determine whether it represents a...
Curated OER
Functions and the Vertical Line Test
Students examine functions and function notation. They use computer activities to discover how to graph functions, and conduct a vertical line test. Students describe spatial relationships using coordinate geometry.
Curated OER
Making a Line Graph
In this line graph worksheet, students use data given in a table and assign axes, make a scale, plot data and make a line or curve on their constructed graphs.
Curated OER
Graph it!
Sixth graders view a Stacked Graph, and discuss what it shows. Students discuss the basics of graphing: labels, intervals, legends x and y axis... Students create individual stacked graphs from provided information. Students view a...
Curated OER
M&Ms; Line Plots and Graphing
Students, using small individual bags of M&Ms, engage in activities including; estimating, sorting, graphing, mean, median, mode, fractions, percentage, and averaging.
Curated OER
Graphing and the Coordinate Plane
Students examine the four quadrants of Cartesian coordinate plane. They play maze games and coordinate games to discover how to read and plot points on the plane. Students plot points on the coordinate plane and examine the ratio of...
Curated OER
Learning to Make Line Graphs
Students analyze data and create a line graph. In this graphing lesson, students explore data from a previous experiment and plot the information on a line graph. Students analyze their findings.
Curated OER
Basic Algebra and Computers: Spreadsheets, Charts, and Simple Line Graphs
Students, while in the computer lab, assess how to use Microsoft Excel as a "graphing calculator." They view visual representations of line graphs in a Cartesian plane while incorporating basic skills for using Excel productively.
Curated OER
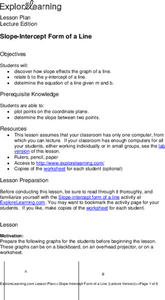
Slope-Intercept Form of a Line
High schoolers determine how the slope affects the graph of a line. They relate "b" to the "y"-intercept of a line and solve the equation of a line given "m" and "b." They are given scenarios and possible answers to which they explain...
Curated OER
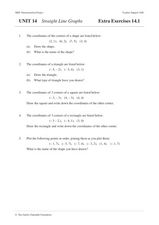
Straight Line Graphs
In this algebra instructional activity, students graph coordinate pairs on a coordinate plane. They match points with letters and graph a line through all the plotting to create a straight line. There are 25 questions with an answer key.
Curated OER
Spaghetti Graphs
Learners work in pairs to test the strength of spaghetti strands. They collect and graph data to determine a line of best fit. Students create a linear equation to interpret their data. Based on the data collected, learners predict...
Curated OER
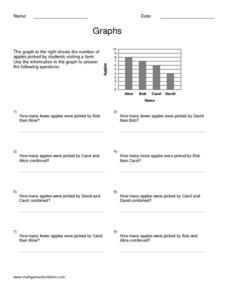
Graphs
For this graphing worksheet, students read information and study diagrams about graphing. Students complete 3 graphing activities.
Curated OER
Frequency Tables and Stem-and-Leaf Plots
Students are introduced to the function of frequency tables and stem and leaf plots. In groups, they determine the frequency of their teacher coughing, ringing a bell or raising their hand. To end the lesson, they determine frequency...
Curated OER
You Can Get There From Here - Plotting on a Coordinate Plane
In this plotting worksheet, students plot given ordered pairs on a coordinate plane. After plotting each ordered pair, students connect line segments in consecutive order. Upon completion of the graphing exercise, students will have...
Curated OER
What's Brewing? Graphing On A Coordinate Plane
In this graphing worksheet, middle schoolers graph given ordered pairs on a coordinate plane and connect the dots in consecutive order. Upon completion of the graphing exercise, students will have created a picture on the coordinate...
Curated OER
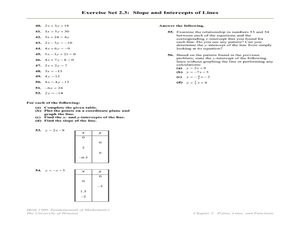
Slope, Intercepts, and Graphing a Line
In this intercepts and slope worksheet, students find the slope and/or the x and y-intercepts in fifty-three problems. Students also graph lines using the x and y-intercepts.
Curated OER
Graphing
In this graphing worksheet, students solve and graph 10 different problems that include determining various coordinates and the slope. First, they use the table to write the x and y coordinates for each point on the graphs. Then,...
Curated OER
Graphing My Path to Success
Seventh graders examine their school performance through self-assessment of strengths and weaknesses. They construct a line graph, plotting all courses and achievements. Students use graph paper and colored pencils for each activity. If...


