Illustrative Mathematics
Half of a Recipe
Kids love to cook! What is a better place to learn mixed numbers than with a recipe? It is up to learners to decide how they want to divide this recipe in half. They may choose to model the mixed number and then divide the model by two....
Curated OER
Ready for Roots
Fourth graders sort seeds and predict what conditions are needed for them to germinate. They keep the seeds moist, observe and measure their growth and graph the results. As the seeds start to grow students compare and contrast the each...
Curated OER
Coordinate Geometry
Grab your class and get them graphing polygons on a coordinate plane! They investigate the four quadrants, discover the x and y axis, and correctly plot ordered pairs. To show their comprehension, each child creates a coordinate picture...
Alabama Learning Exchange
Keep It Movin'!
Learners conduct an experiment to study friction. They complete a KWL chart on friction and conduct an activity about the amount of friction on a moving object. To conclude, pupils create a table or graph of the data collected and they...
Curated OER
Download and Analyze
Students download information from a NASA website into a database. They transfer it to a spreadsheet by completing the information and analyze the information. They determine temperature averages, mode, and graph the results. They write...
Curated OER
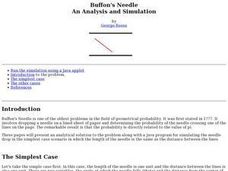
Buffon's Needle An Analysis and Simulation
If you dropped a needle on a lined sheet of paper what is the probability that the needle will cross one of the lines on the page? Surprise your class with how calculating this probability can approximate pi. This question is known as...
Curated OER
"Favorite Fairy Tale Characters"
Third graders enter the results of their survey on a spreadsheet. They construct a bar graph showing the results.
Mathematics Assessment Project
Middle School Mathematics Test 3
Real-life mathematics is not as simple as repeating a set of steps; pupils must mentally go through a process to come to their conclusions. Teach learners to read, analyze, and create a plan for solving a problem situation. The provided...
Curated OER
A Steep Hike
Students explore slope. In this middle school mathematics lesson plan, students analyze and interpret graphs as they investigate slope as a rate of change. Students use a motion detector to collect data as they walk at different speeds...
Yummy Math
Deflate-gate
Does temperature affect the air pressure of a football? Young mathematicians look at the readings from a pressure gauge and determine if the balls are within regulation or are under inflated.
Curated OER
How Does a Seed Grow Into a Plant?
Second graders explore how seeds grow into plants. They discuss types of seeds and place seeds in wet paper towels to germinate. They draw a picture in their journal to record their observations for four days. They take pictures of their...
Curated OER
Jelly Belly: What a Wonderful "Bean"!
Students explore how jelly beans are produced. They discuss the origins of the jelly bean and view a video about how jelly beans are prepared, tested, shaped, finished, and shipped and estimate the amount of jelly beans in a jar and sort...
Curated OER
Car Maze competition
Young scholars use graphs to calibrate an RCX car. They must then program the car to traverse a maze using their calibrations
Curated OER
How Far Will It Roll?
Learners construct a car with the longest roll using a ramp. They construct Lego cars, modify the wheel sizes and car configurations to evaluate which car design rolls the longest distance, develop a graph, and complete a worksheet.
Curated OER
How Much Will I Spend On Gas?
Students construct a linear graph. In this graphing lesson, students determine a monthly budget for gasoline. Students construct a t-chart and coordinate graph to display data. Resources are provided.
Curated OER
Sonar Mapping
Students use a shoe box to create a seafloor model and use cardboard for layering inside of the shoe box to simulate the ocean floor. They probe the ocean floor to simulate sonar echoes. Finally, students graph their data to get a...
Curated OER
The Coordinate Plane
Fifth graders use the attached worksheet, Where's My Location? - Directions, to play a game in which they plot points on a grid.
Curated OER
Patterns in Nature
In this patterns in nature learning exercise, students read about the Fibonacci Spiral, then follow the directions to plot one on the graph paper and draw the spiral, with links to more information.
Curated OER
Tally Time
Students create a tally chart. In this math and health instructional activity, students discuss healthy foods and create a tally chart showing the number of students who like to eat healthy foods.
Curated OER
Bird Feeding and Migration Observation
Students research bird migration and build a bird house. In this bird lesson plan, students research the birds in their area and where they migrate to. They also build their own bird house and record data on what kinds of birds come to...
Curated OER
Technology: Programming Graphics
Students use the DrScheme program to create graphics for clip art. Using graphics, they plan their designs using basic shapes, plotting its positions, and studying the relationships between points. By plotting the necessary data on...
Curated OER
Track's Slippery Slope
Middle schoolers graph data of sports figure running time using x-axis y-axis to find slope of trend line, mathematically find the interpolated and extrapolated values for data points. Using the information they make predictions.
Curated OER
Missed The Boat
Students complete time and distance problems. Using appropriate problem solving strategies, students determine when a helicopter will catch a cruise ship. Students write a summary of their solution process. They complete a graph to...
Curated OER
Point Reflection
Use this task as an exit ticket for your eight graders during the geometry unit. All they need to do is identify the coordinates of a point reflected over y=2000.


