Curated OER
Point-Slope Form
Ninth graders explore the point-slope form of linear equations and graph lines in the point-slope form. After completing the point-slope equation, they identify the slope of a line through a particular point. Students explain the...
Curated OER
Standard Linear Form
Ninth graders identify and describe the x-intercept as the place where the line crosses the x-axis as it applies to football. They create their own differentiations to reinforce the distinction between the x-intercept and the...
Curated OER
Said Is Dead
Students revise writing to improve organization and word choice. They check for logic, order of ideas and precision of vocabulary. Students list different verbs for the word "said." They write dialogue in which the speakers tell a story...
Curated OER
History of Our Solar System Time Line
Ninth graders explore the concept of ratios. In this ratio lesson, 9th graders construct a to scale time line that starts at the beginning of time. Students determine the correct placement of big events in time such as when the dinosaurs...
Curated OER
Growing Plants
Students grow plants and track their growth over time. In this growing plants lesson plan, students plant seedlings and chart their growth in a data analysis activity.
Curated OER
Graphing Linear Functions - Review
Students graph linear functions. They plot three points, create a line, and discuss methods to find the slope of line. In groups, students solve problems, graph their lines and find the slope of a line using various methods. Upon...
Curated OER
Constellation Mapping
Students plot constellations on a grid map. They discuss the various ways early explorers planned their travels. Students identify and recognize major constellations. They color their maps and take them home to try to find various...
Curated OER
Expressing Emotions Through Art Lesson 2: Everybody Needs Somebody
Learners examine works of art that depict two people who care for each other, and analyze how artists use line, shape, color, and space in works of art. They use line, shape, color, and space to create drawings that depict two people...
Curated OER
WHAT DO BEARS EAT AND HOW DO THEY WALK?
Students listen to the poem "Five Bears" read aloud several times, and study what bears eat by naming the foods (mentioned in the poem) out loud. They draw a picture to illustrate one line of the poem and practice choral reading.
Curated OER
Five-Alive: The Value of Fruits and Vegetables
Students discuss importance of proper nutrition in staying healthy, examine food pyramid chart and identify different vegetables or fruits via eye gaze, and sample different vegetables or fruits at snack or lunch time.
Curated OER
Investigation: Peg Race
Students explore competition by participating in a peg race. In this pattern creation lesson, students utilize an egg timer and pegs or colored cubes to create patterns quickly while competing with fellow classmates to finish first....
Curated OER
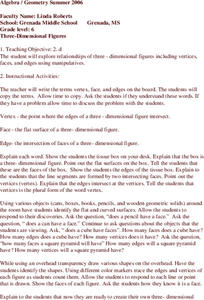
Three-Dimensional Figures
Sixth graders explore three-dimensional objects. Using various objects found in the classroom, they identify faces, edges, and vertices of objects. Students create their own objects. They describe the polydron, telling the faces,...
Curated OER
Air Masses & Fronts
Students use a set of maps depicting a front passing through the state to identify two distinct air masses and the frontal boundary. They then deterine whether the front is moving in time and in what direction the front is moving.
Curated OER
Newsworthy Images
Learners examine images from newspapers and create their own photos to tell a story. In this photojournalism lesson, students analyze a photograph using the elements and principles of art then create a photographic image that tells...
Curated OER
Newsworthy Images
Learners examine images from newspapers, the photo cropping process, and create their own photos to tell a story. In this photography analysis lesson, students analyze a photograph using the elements of art and analyze their own...
Curated OER
Graphing Data Brings Understanding
Students collect, graph and analyze data. In this statistics lesson, students use circle, pie, bar and lines to represent data. They analyze the data and make predictions bases on the scatter plots created.
Curated OER
Air Masses & Fronts
Students identify two distinct air masses and the frontal boundary and determine whether the front is moving in time and in what direction the front is moving.
Curated OER
Ribbon Wand Dancing
Pupils construct a ribbon wand which, through the use of line, color, contrast and shape can be used to better express a given emotion. Students improvise a brief dance created through manipulation of ribbon wand using three distinct...
Curated OER
Graphing Using Cookies
Students differentiate between bar graphs, line graphs, pictographs and bar graphs. After participating in a hands-on cookie activity, students label and draw their own graphs.
Curated OER
Length and Area
Fourth graders measure one centimeter cubed blocks to determine their size. They measure lines using a worksheet that is not included in the lesson. Next, they measure the area of figures on the sheet using the cubes in place of a ruler.
Curated OER
Thanksgving Poem
First graders read a Thanksgiving poem to build reading comprehension skills. They develop the skill of using context clues while explaining the meaning of each line of the poem. The assessment is done as the teacher listens to poems...
Curated OER
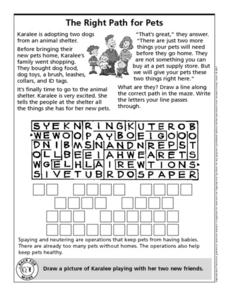
The Right Path for Pets
In this animal care worksheet, students learn the important steps to take before adopting a dog from an animal shelter. Students follow a maze of letters which eventually tell them about spay/neutering for pets.
Curated OER
Spark Activity: Counting Laps
Students move around a makeshift "track" set up by the teacher, moving around it as many times as they can before the stop signal. Students begin by power walking and slow-jogging, then build up speed as they proceed. Students call out...
Curated OER
Race Track (Culminating Activity)
Students graph and solve linear equations. In this algebra lesson plan, students use the slope and y-intercept to graph lines. They relate lines to the real world using different applications.


