Texas Instruments
Texas Instruments: Getting Started With the Ti Navigator System: River of Life
This lesson introduces students to Activity Center and is intended to help students develop the conceptual understanding of how to identify functions as linear or nonlinear and contrast their properties from tables, graphs, or equations.
University of Waterloo (Canada)
Univ. Of Waterloo: Wired Math: Linear Graphing: Graphing and Analyzing [Pdf]
The mathematics resource assesses learners on linear relations. The activity has problems with graphing and analyzing linear relations. Some of the topics included are variation, scatter plots and linear relationships. The worksheet has...
Ministry of Education and Universities of the Region of Murcia (Spain)
Ministerio De Educacion Y Ciencia: Funciones: Expresion Grafica Y Verbal
In Spanish. Interpret the graph of linear and non linear functions with this interactive activity.
Other
Increasing, Decreasing, Maximum and Minimum Functions
This site provides a portion of a textbook that explores increasing and decreasing functions. Students are provided examples and then have practice problems they can attempt to master the concept.
Mangahigh
Mangahigh: Algebra: Form Equations With Exponents
Mangahigh is a website with math games aimed at twelve to eighteen year olds. On this site students form nonlinear equations.
CK-12 Foundation
Ck 12: Algebra: Linear and Non Linear Function Distinction
[Free Registration/Login may be required to access all resource tools.] Distinguish between linear and non-linear functions
CK-12 Foundation
Ck 12: Algebra: Linear and Non Linear Function Distinction
[Free Registration/Login may be required to access all resource tools.] Distinguish between linear and non-linear functions.
Khan Academy
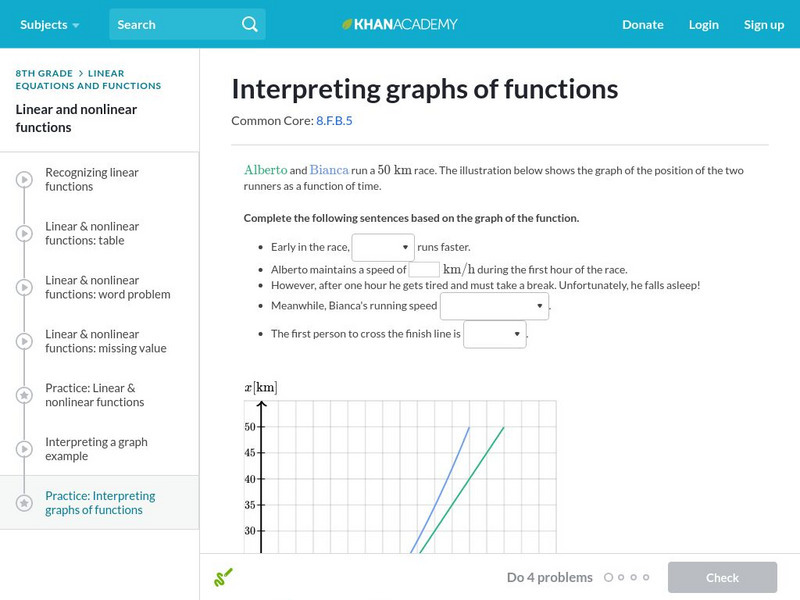
Khan Academy: Interpreting Graphs of Functions
Interpret the graphs of both linear and nonlinear functions. Students receive immediate feedback and have the opportunity to try questions repeatedly, watch a video, or receive hints.
Khan Academy
Khan Academy: Graphs of Nonlinear Piecewise Functions
Given the graph of a nonlinear piecewise function, find its formula. Students receive immediate feedback and have the opportunity to try questions repeatedly, watch a video or receive hints.
Khan Academy
Khan Academy: Lsn 13: Systems of Equations, Algebraic and Graphical Representations
Lesson 3 of 4 for Passport to Advanced Math. Students will solve systems of equations in two variables in which one equation is linear and the other equation is quadratic or another nonlinear equation; relate properties of the function f...
Texas Instruments
Texas Instruments: Getting Started With the Ti Navigator: Quadratic Equations
This lesson introduces students to Activity Center and is intended to help students write systems of equations in standard form in slope intercept form to solve the system using tables and graphs.
CK-12 Foundation
Ck 12: Algebra: Linear and Non Linear Patterns of Change
[Free Registration/Login may be required to access all resource tools.] Model and solve real-world problems involving patterns of change
Richland Community College
Richland Community College: Math 116 Lecture Notes
This site from the Richland Community College provides the detailed lecture notes to a college algebra course, complete with equations and definitions. Content ranges from "functions and their graphs" to "conics and parametric equations."
Interactive Mathematics
Interactive Mathematics: Graphical Solution of Non Linear Systems
Using the graphing method, several systems of nonlinear equations are solved. Follow each example step by step to see how solutions are derived.
Khan Academy
Khan Academy: Interpret Equations Graphically
Practice the connection between the graphical representation of equations and their algebraic solutions. Students receive immediate feedback and have the opportunity to try questions repeatedly, watch a video, or receive hints.
Alabama Learning Exchange
Alex: Relationship Between Height and Length
In this lesson, eighth grade students will collect data. They will use this data to analyze the relationship between the height of an individual and the length of his/her foot. Students will use a line of fit to make predictions for...


![Univ. Of Waterloo: Wired Math: Linear Graphing: Graphing and Analyzing [Pdf] Unknown Type Univ. Of Waterloo: Wired Math: Linear Graphing: Graphing and Analyzing [Pdf] Unknown Type](https://d15y2dacu3jp90.cloudfront.net/images/attachment_defaults/resource/large/FPO-knovation.png)

