EngageNY
The Height and Co-Height Functions of a Ferris Wheel
Show learners the power of mathematics as they model real-life designs. Pupils graph a periodic function by comparing the degree of rotation to the height of a ferris wheel.
CK-12 Foundation
Determining the Equation of a Line: Temperature Conversion Challenge
Line up the temperature conversions. Pupils create the linear function between Celsius and Fahrenheit on a graph by plotting the freezing and boiling points of water. The scholars determine how the relationship changes based upon...
Shodor Education Foundation
Function Flyer
Fly through graphing functions with the Function Flyer. Young mathematicians use an interactive to graph different types of functions. A set of exploration questions has users investigate patterns in functions.
EngageNY
Modeling with Exponential Functions
These aren't models made of clay. Young mathematicians model given population data using exponential functions. They consider different models and choose the best one.
101 Questions
The Mystery Line
Take the mystery out of linear functions. Provided an image with no scale, learners guess where the line that connects them might cross the y-axis. After providing the coordinates of the points, they realize scale is an important...
Curated OER
Graphing Linear Functions
Seventh graders identify the use of a function.They are asked to describe the input and output of a function. Students also identify different aspects of the coordinate system and represent functions in a visual graph.
Curated OER
Linear and Quadratic Approximations
Students explore a linear, a parabolic, and a log function. For this Algebra II/Pre-calculus lesson students investigate the graph a line, a parabola, and a log function. Students examine the three graphs as they compare and contrast...
Curated OER
Graphing Linear Functions
Students practice solving systems of linear equations using the substitution and elimination methods. They determine if the system has one, infinite or no solution. Students also graph the linear equations.
Curated OER
Linear & Quadratic Functions: Solving Graphically
In this linear and quadratic function worksheet, students examine and solve a system of equations. They graph each function on a coordinate plane. This one-page worksheet contains ten problems.
Curated OER
Linear Functions
Fifth graders investigate the concept of a function in relationship to how it is used. The concept is essential for the future study of Algebra. They apply the use of patterns with its relationship to functions.
Curated OER
Functions Mixed Review: Pracctice A
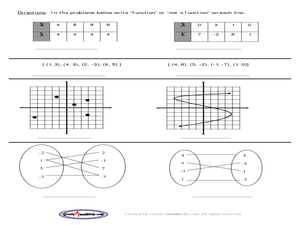
Ninth graders review their knowledge of functions. In this Algebra I lesson, 9th graders determine if equations are linear or nonlinear, determine the slope and y-intercept of equations, and determine if a relation is a function in this...
Curated OER
Exploring F function Graphs
Using three set of data that relate temperature to another variable, 10th graders will use graphs, tables, or equations to make predictions about data. Students will identify the relations as linear or non-linear. Students will define...
Curated OER
Functions Can Be Fun!
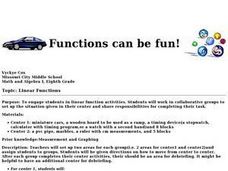
Eighth graders work together in groups to discover linear functions. They are giving a situation and they are to recreate it in their groups. They answer questions to complete the instructional activity.
Curated OER
Activity 11: Family of Functions
Students investigate linear, quadratic, and absolute value functions. In this Algebra II lesson, students observe and describe family traits that exist among functions as they use technology to graph several functions on the same...
Curated OER
Linear Equations
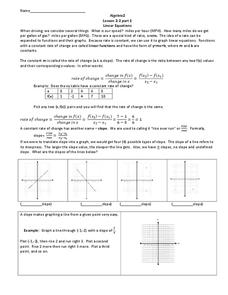
Pre-algebra pupils examine the rate of change and how we can interpret it as a linear function. They are introduced to slope-intercept equations and graphs. Plenty of instruction is provided along with example problems. Note that even...
Curated OER
Triangles Inscribed in a Circle
Are you tired of answers without understanding? Learners can give a correct response, but do they really understand the concept? Have young mathematicians think deeper about linear functions, angles, and formulas in algebra. Learners are...
Curated OER
Wrapping It All Up
Through learning how to examine linear, quadratic, and exponential functions, students explore the effects of changes in parameters on the graphs of linear, quadratic, and exponential functions. The lesson is designed to be a review of...
Curated OER
Connecting Factors and Zeros
For this Algebra II lesson, students explore the connection between the factored form of a quadratics and the zero of a function. Students use a graphing calculator to verify factoring numerically and graphically.
Curated OER
Linear Functions
In this algebra instructional activity, students solve linear equations by identifying the slope and y-intercept of the equation. They have to rewrite some of the equations in to y= mx + b forms first. There are 4 questions with an...
EngageNY
Analyzing a Verbal Description
What function will describe the insect population growth? Pairs or small groups work together to determine which type of function and specific function will model given scenarios. The scenarios differentiate between linear, exponential...
Inside Mathematics
Picking Apples
Getting the best pick of the apples depends on where to pick. The short assessment presents a situation in which class members must analyze a real-world situation to determine the cost of picking apples. The pricing structures resemble...
West Contra Costa Unified School District
Writing Exponential Functions Based on Data
Give your class a concrete example of exponential growth and decay using this hands-on activity. These Algebra II lessons allow for the exploration of exponential growth and decay models, as well as the discovery of the patterns of each....
EngageNY
Choosing a Model
There's a function for that! Scholars examine real-world situations to determine which type of function would best model the data in the 23rd installment of a 35-part module. It involves considering the nature of the data in addition to...
Curated OER
Linear Programming
In this algebra activity, students calculate the maximum and minimum of a shaded region. They identify the boundaries and their vertices's. There are 2 problems.
Other popular searches
- Graphing Linear Functions
- Linear Functions and Graphs
- Writing Linear Functions
- Nonlinear Functions
- Inverse Linear Functions
- Graphs of Linear Functions
- Nonlinear Equations
- Linear Functions Activity
- Linear Functions Math Models
- Linear Functions to Graph
- Linear Functions and Models
- Power Point Linear Functions


